Do you love music and data visualisation? There is a mini-course for you!
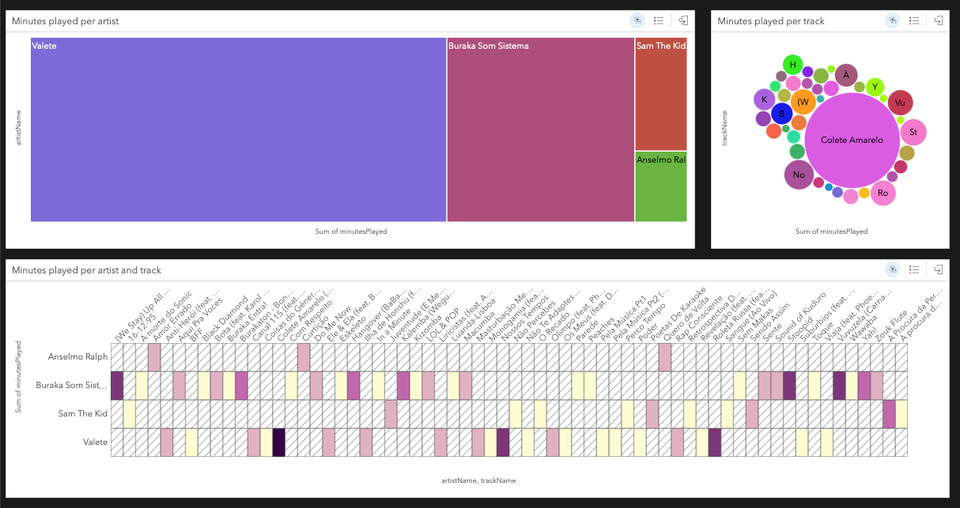
Did you know you can download your listening data from your Spotify account? How cool would it be to create data visualisations that enable you to get insights into your listening habits? I created a free mini-course to inspire and guide you in your exploration. You’ll end up with a data visualisation you’re proud of (or not; it really depends on your music choices 😉) to share with the world!
 Cristina
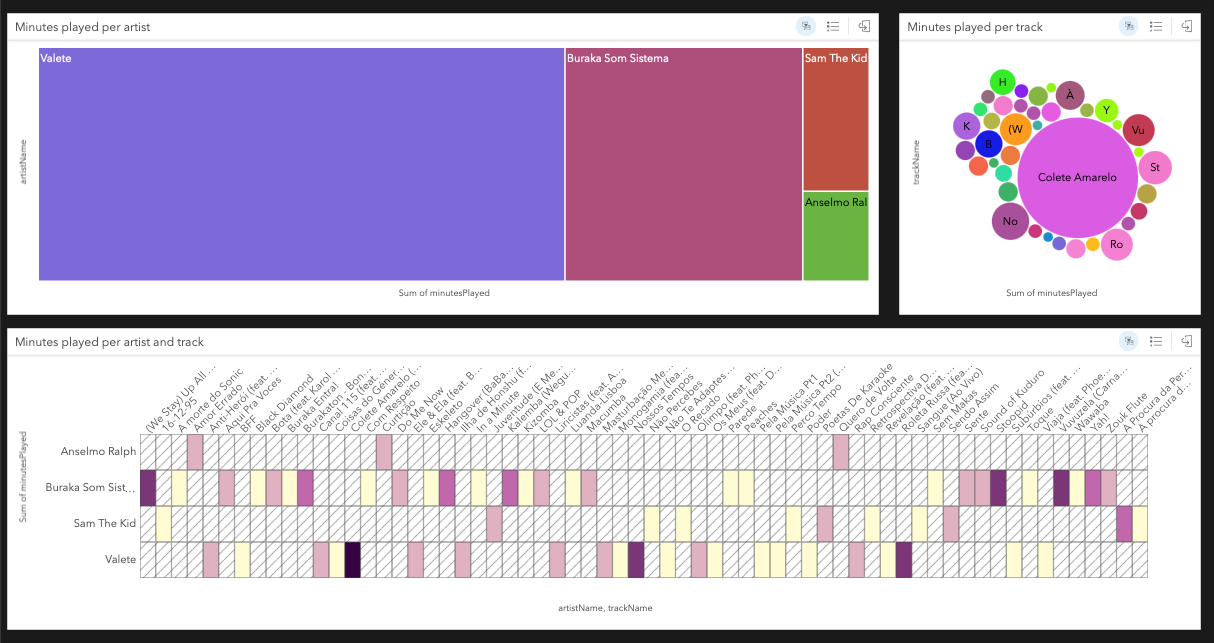
The Monthly with All That Geo
Want to learn how to use ArcGIS Online for spatial, data-driven storytelling? Sign up for The Monthly with All That Geo and I'll deliver a new example of an interactive web app straight to your inbox every month.
You'll get a behind-the-scenes look at how it was built—from the data collection process through the final app—so you can practice your own data visualisation skills and unlock your creativity as you go.
If you want to find inspiration to start a project that will make a difference in your study area or work, sign up for The Monthly with All That Geo!


Member discussion