Tutorial – How to crowdsource data and use it to create a digital map tour

In this tutorial, you'll create a story map that includes a map tour and a survey to crowdsource and showcase places of interest in an area: breweries with an esplanade in Lisbon.
More specifically, you'll use ArcGIS Online to:
- Create a survey to crowdsource data
- Add a vetting field to your survey data model
- Submit a dummy entry to the survey
- Update a view to filter survey records
- Build a story map
- Add a map tour to the story map
- Embed the survey in the story map
- Add a credits section and change the story map’s design
- Publish the story map
- Make a tiny URL to customise the story map even further
This workflow will enable you to crowdsource data from your friends or the wider community. Then, using digital storytelling tools, you'll be able to promote your town or a cause. Even if you’re not interested in beer, you can always repurpose this workflow for other places of interest in your community.
▶️ Let's get started!
1 Choose the tool
Choose → Prepare → Create → Share
This tutorial will use two of ArcGIS Online's most popular apps - Survey123 and StoryMaps.
These apps are available to you for free with any of the following ArcGIS accounts (in addition to paid subscriptions):
Once you create your account (if you haven't got one yet), you're ready to proceed.
2 Prepare the data
Choose → Prepare → Create → Share
Our data in this workflow is crowdsourced using a form created with Survey123. Such a survey form will enable anyone to submit an entry (i.e., a brewery with an esplanade) that will later feature in the map tour.
2.1 Create a survey to crowdsource data
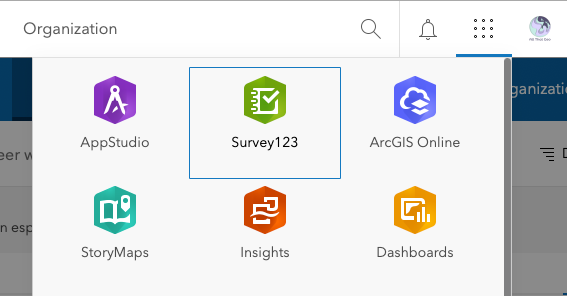
Log in to your ArcGIS Online account.
In the App Launcher (the button with the dots in the top bar), select Survey123.
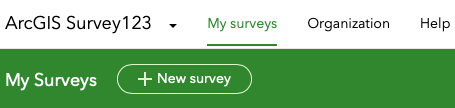
Click on + New survey.
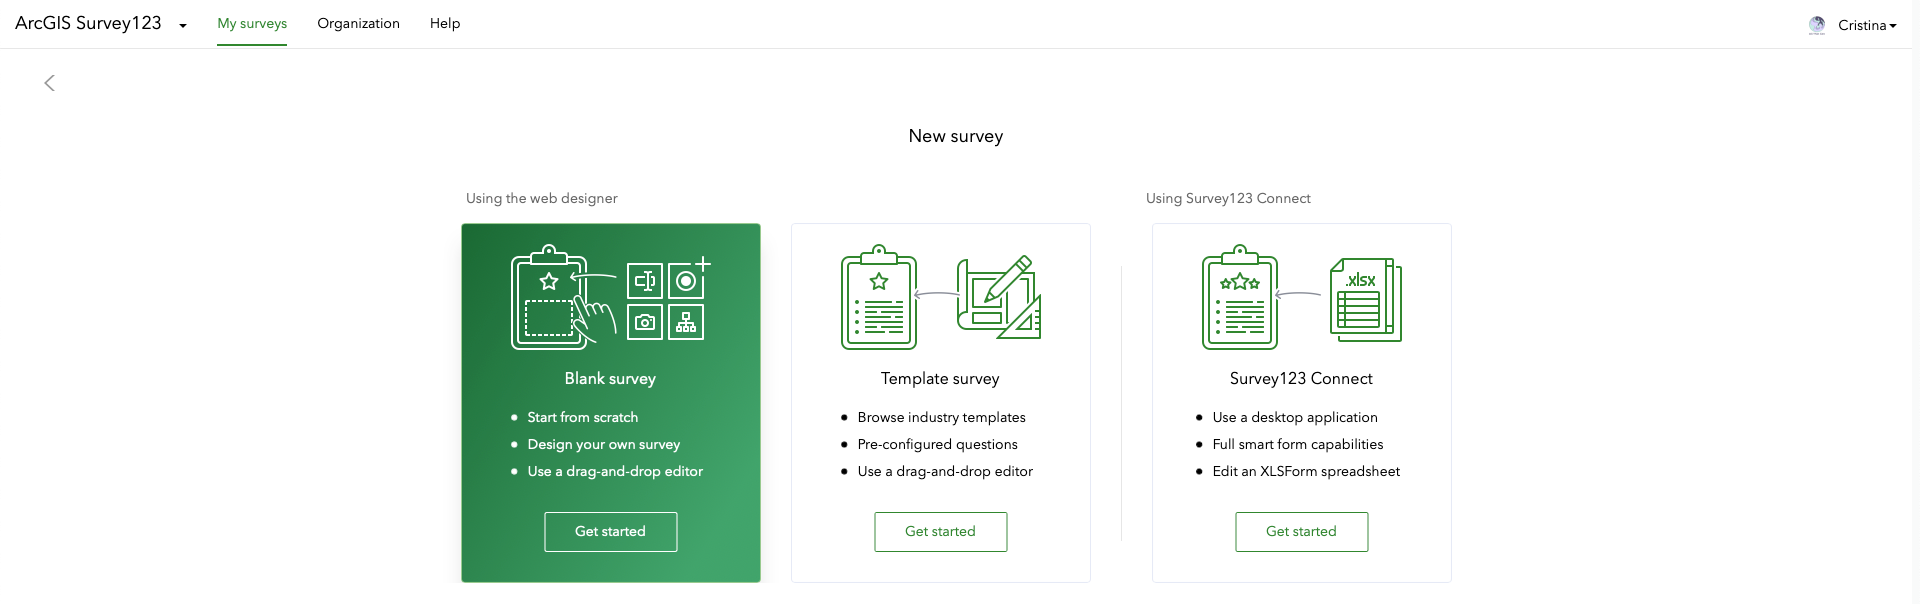
From the three options shown, choose Blank survey.
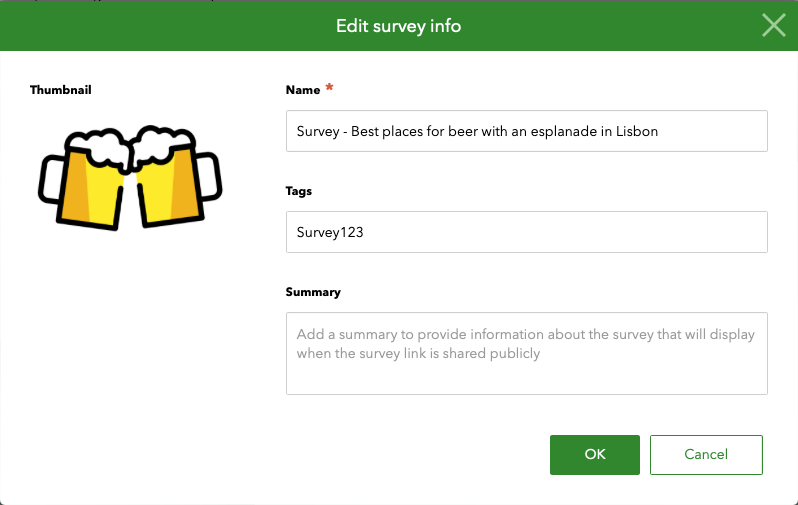
Click on the pencil to Edit survey info.
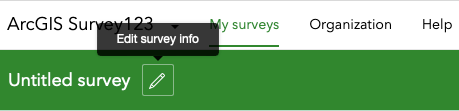
Let's now give the survey a Name.
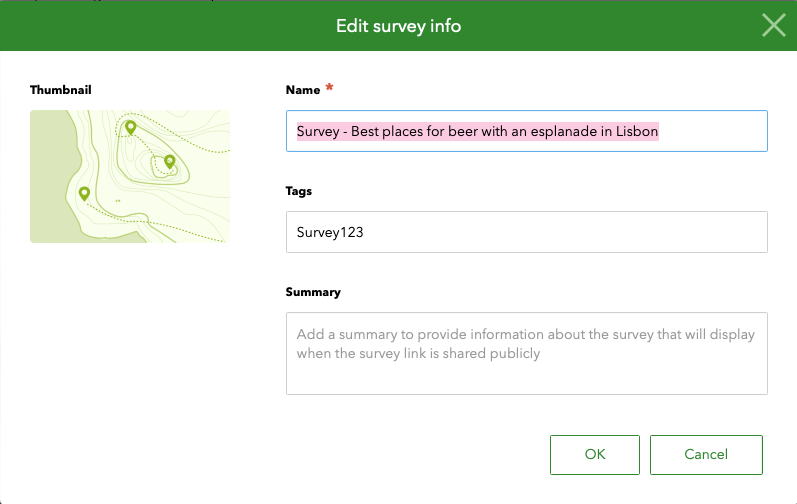
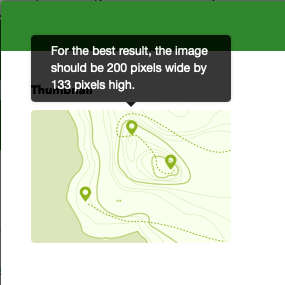
Add a Thumbnail.
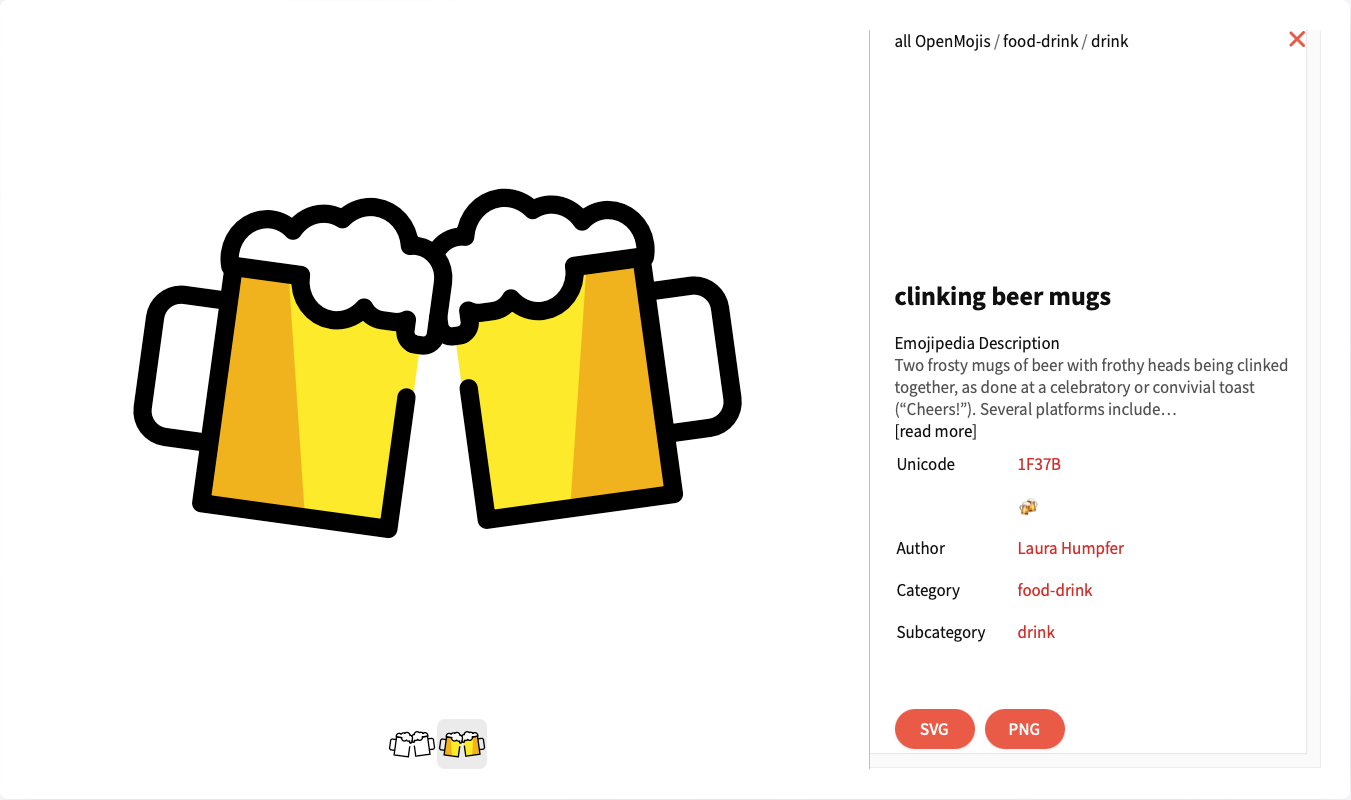
In this tutorial, we'll use an emoji from OpenMoji. Type 'beer' in the search box on the main page.
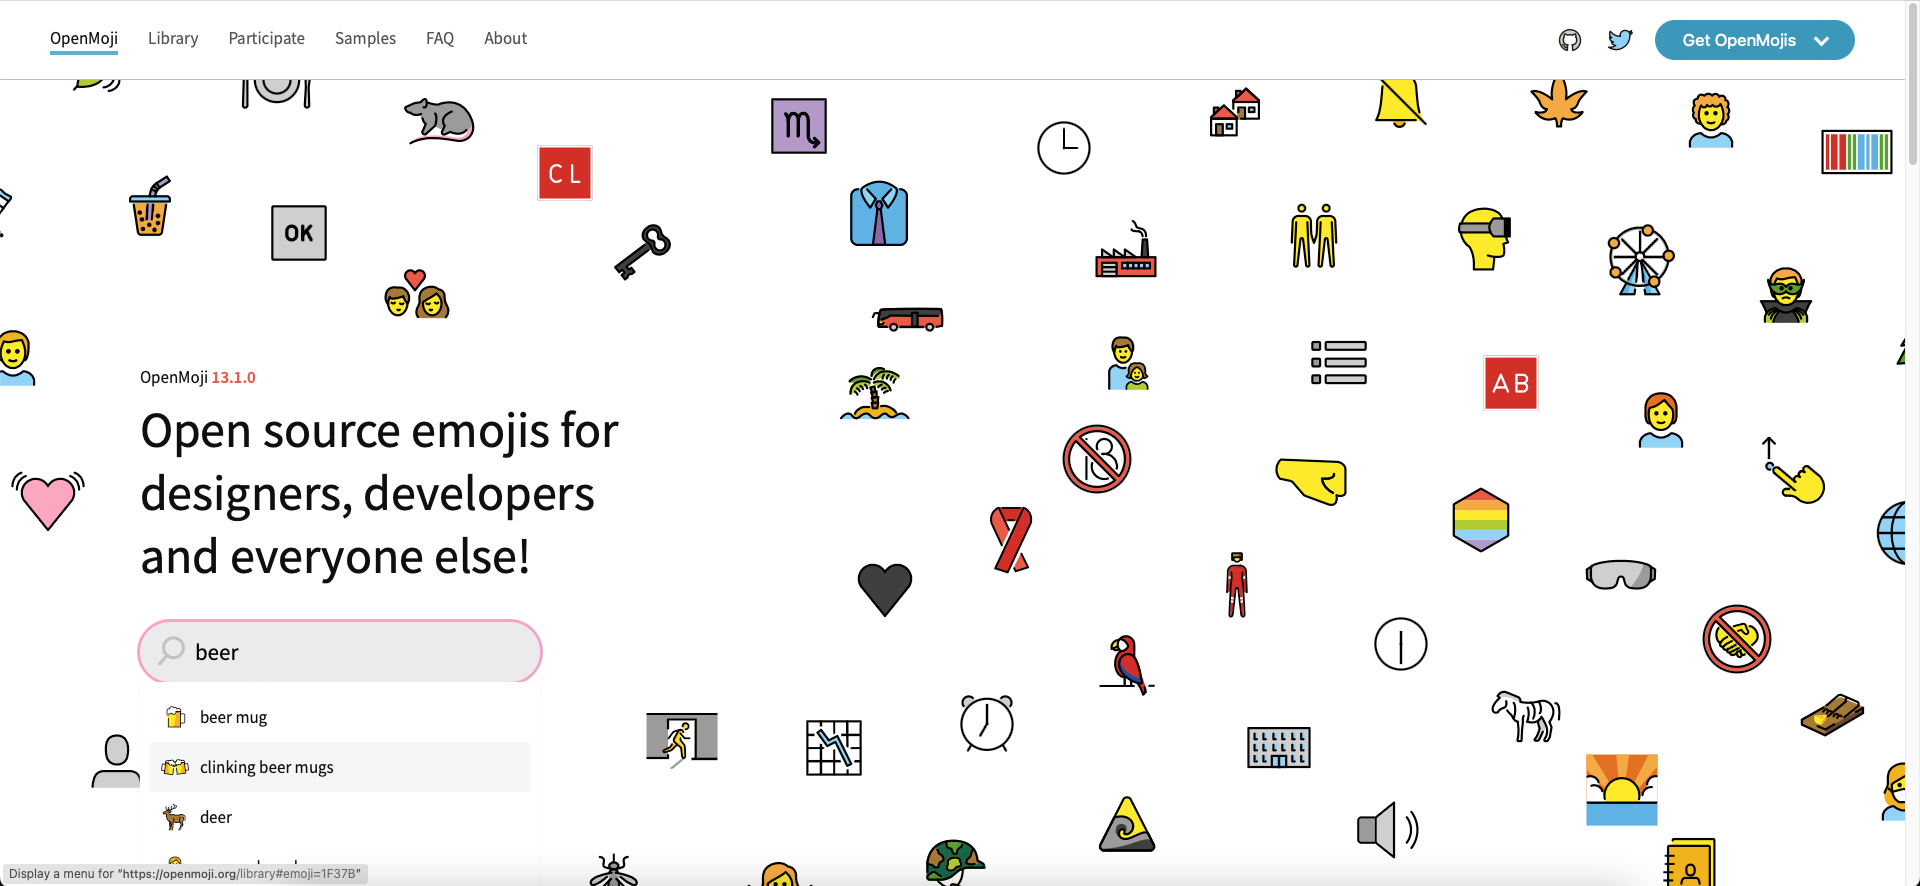
Select drinking beer mugs from the suggestions and download the emoji in PNG format.
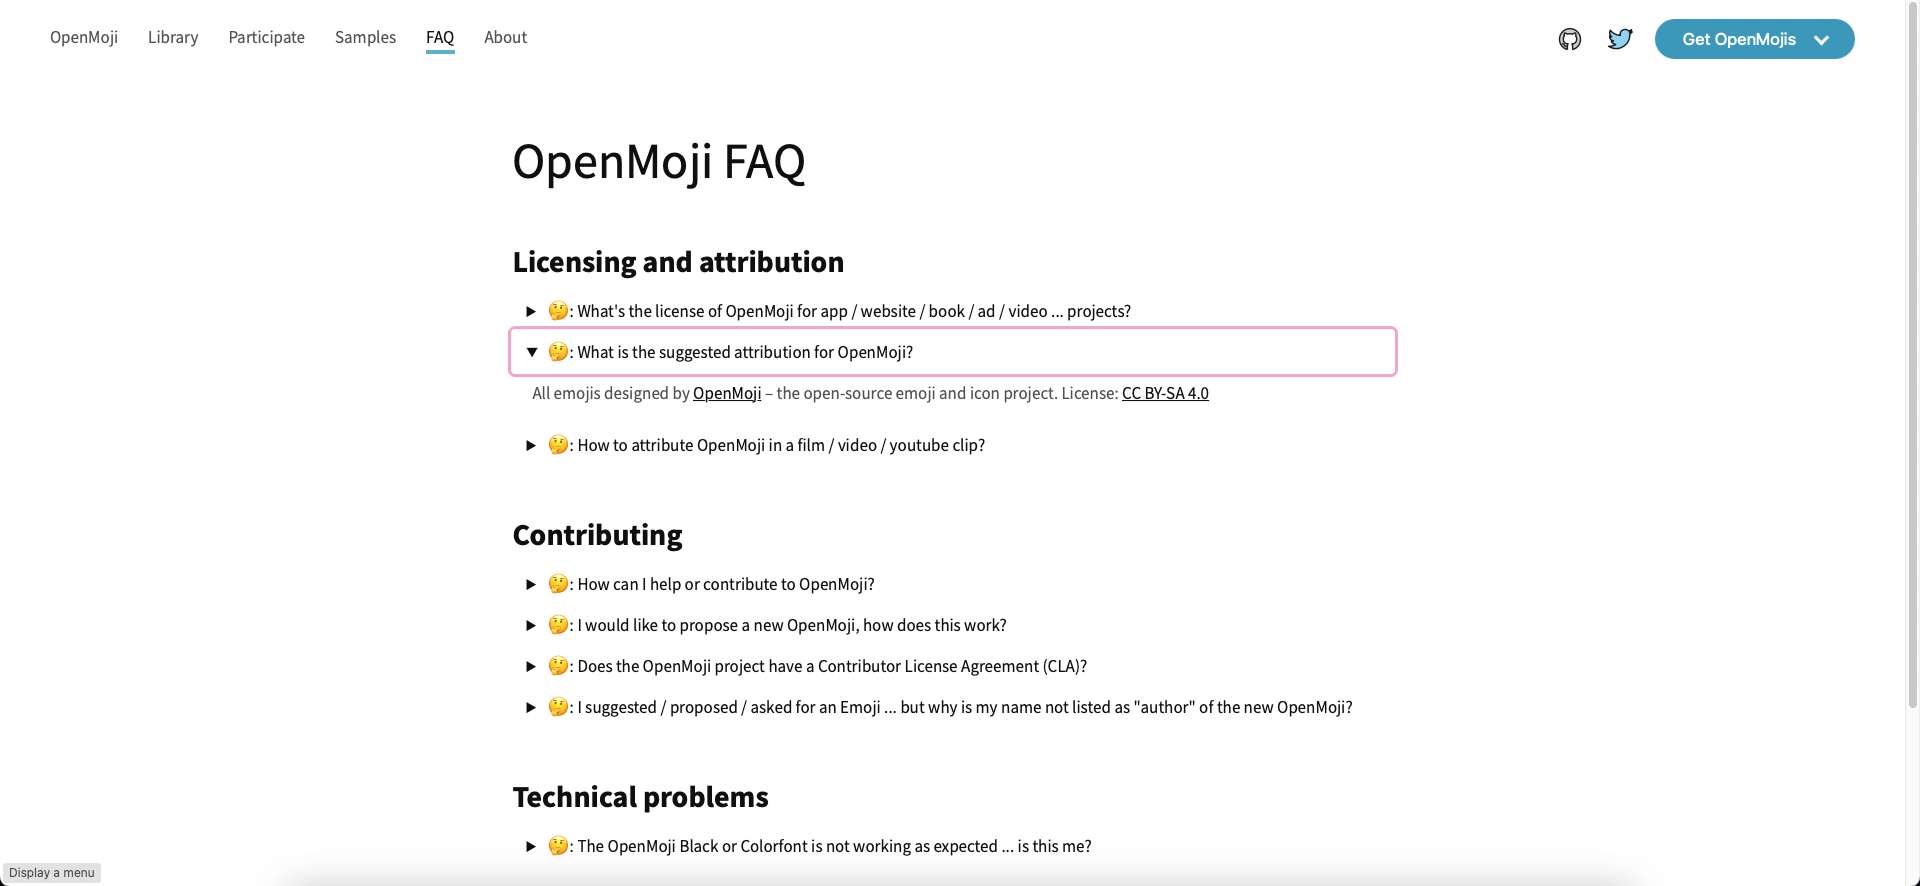
Now go to the FAQ page to know how to do proper attribution. We'll use this later in the story map.
Find the emoji you downloaded to your computer and add it to Thumbnail. Click OK.
You are now taken to the Design section of the survey.
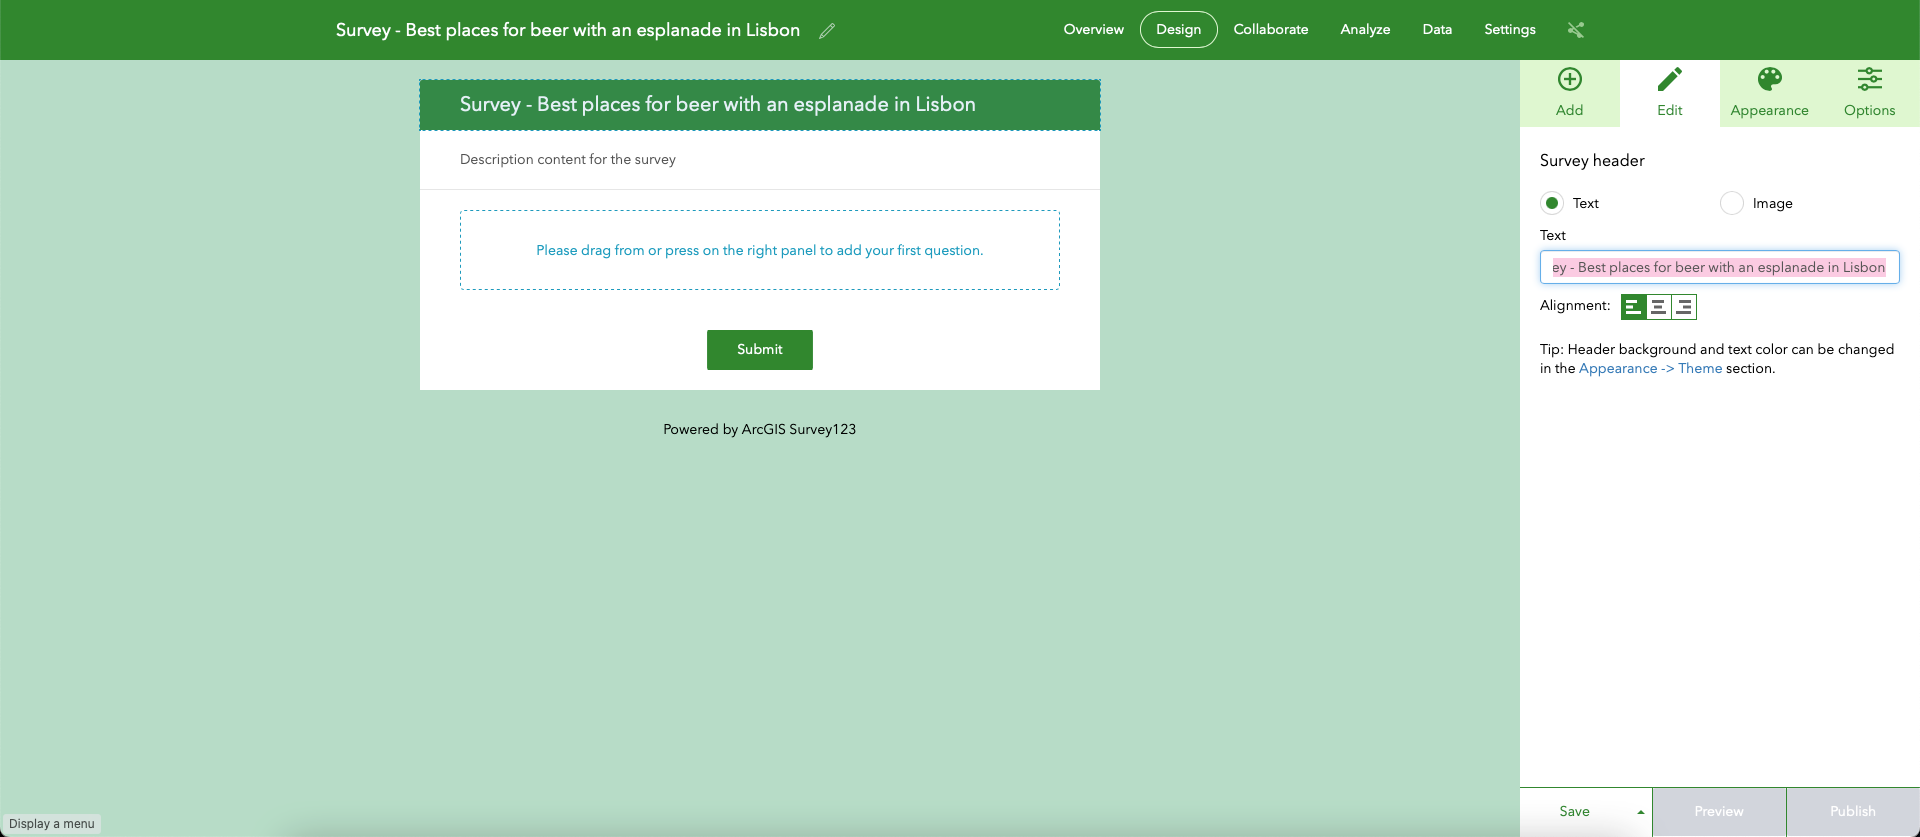
Click on Survey title not set.
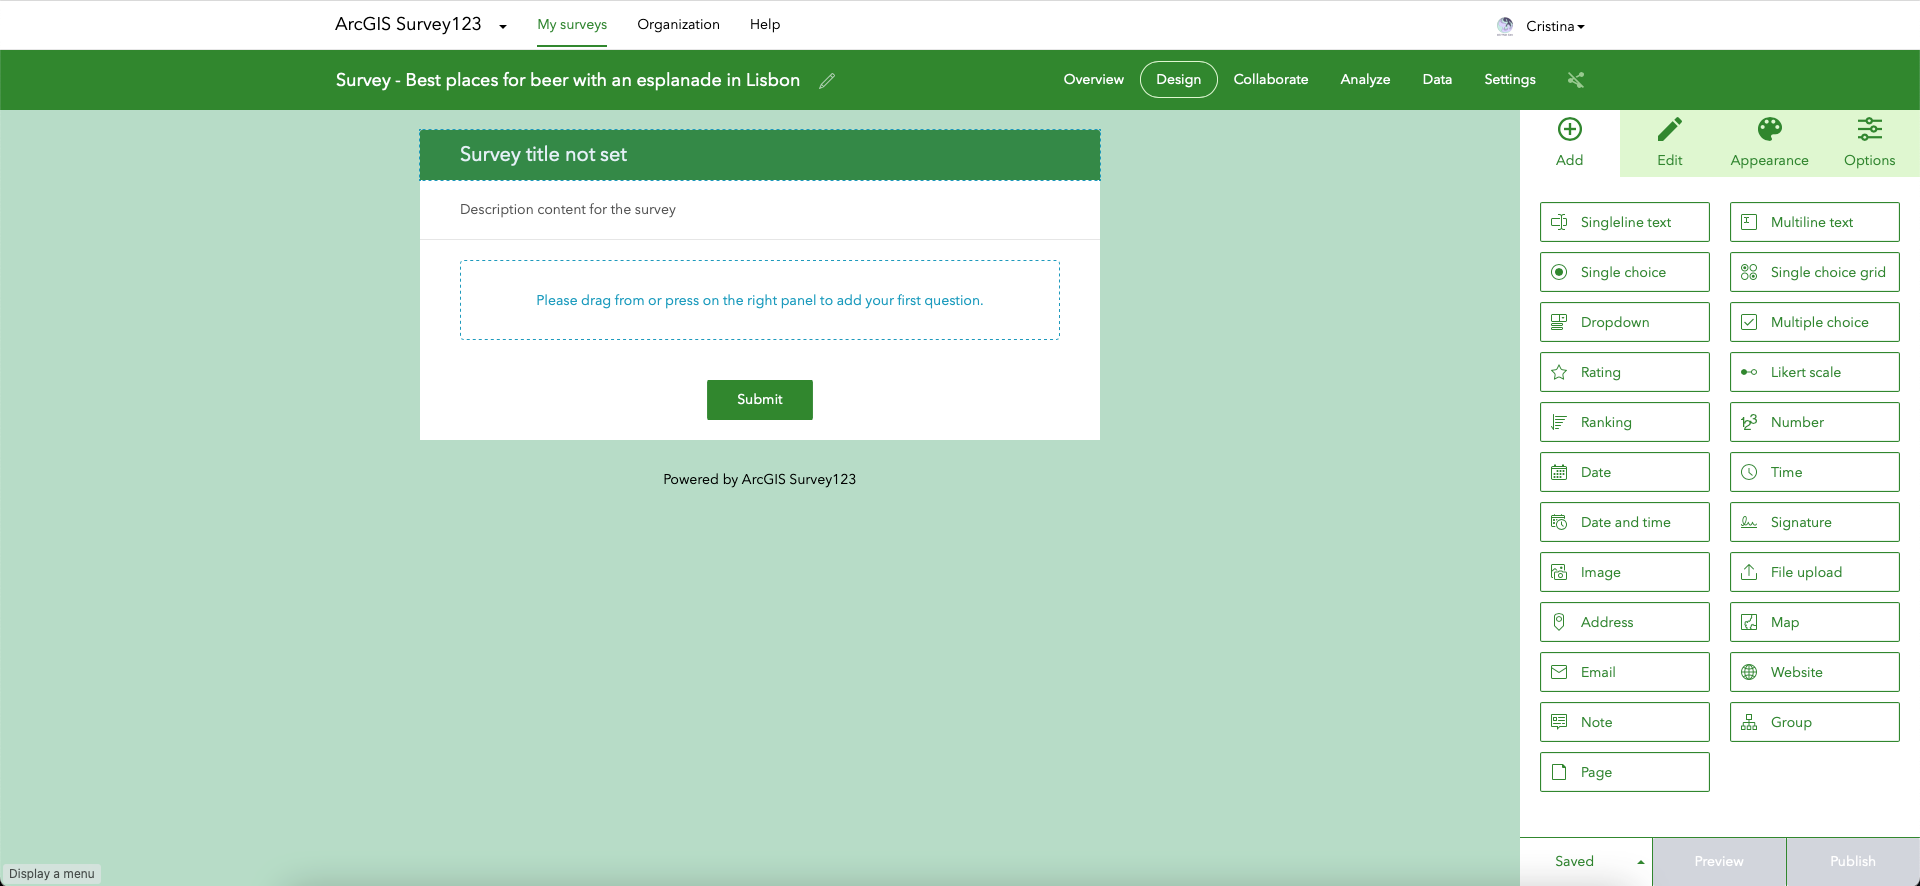
On the right, in the Edit tab, enter a title in Text.
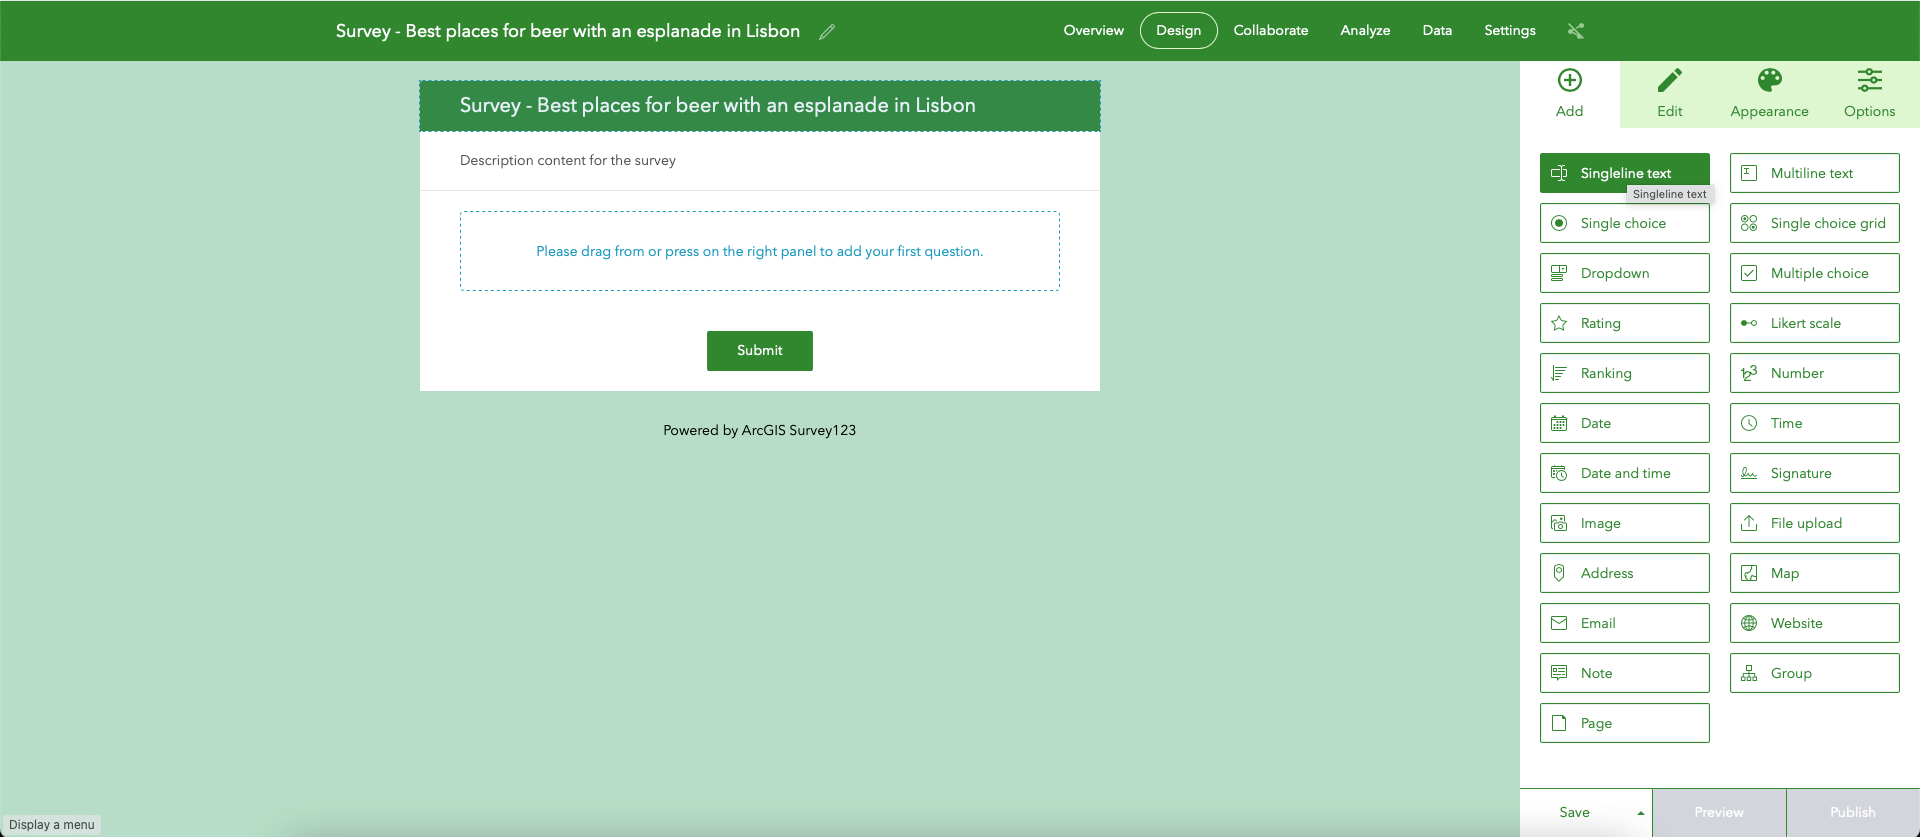
Go back to the Add tab. Here, you’ll choose the type of questions you want to add to your survey form. Start with Singleline text.
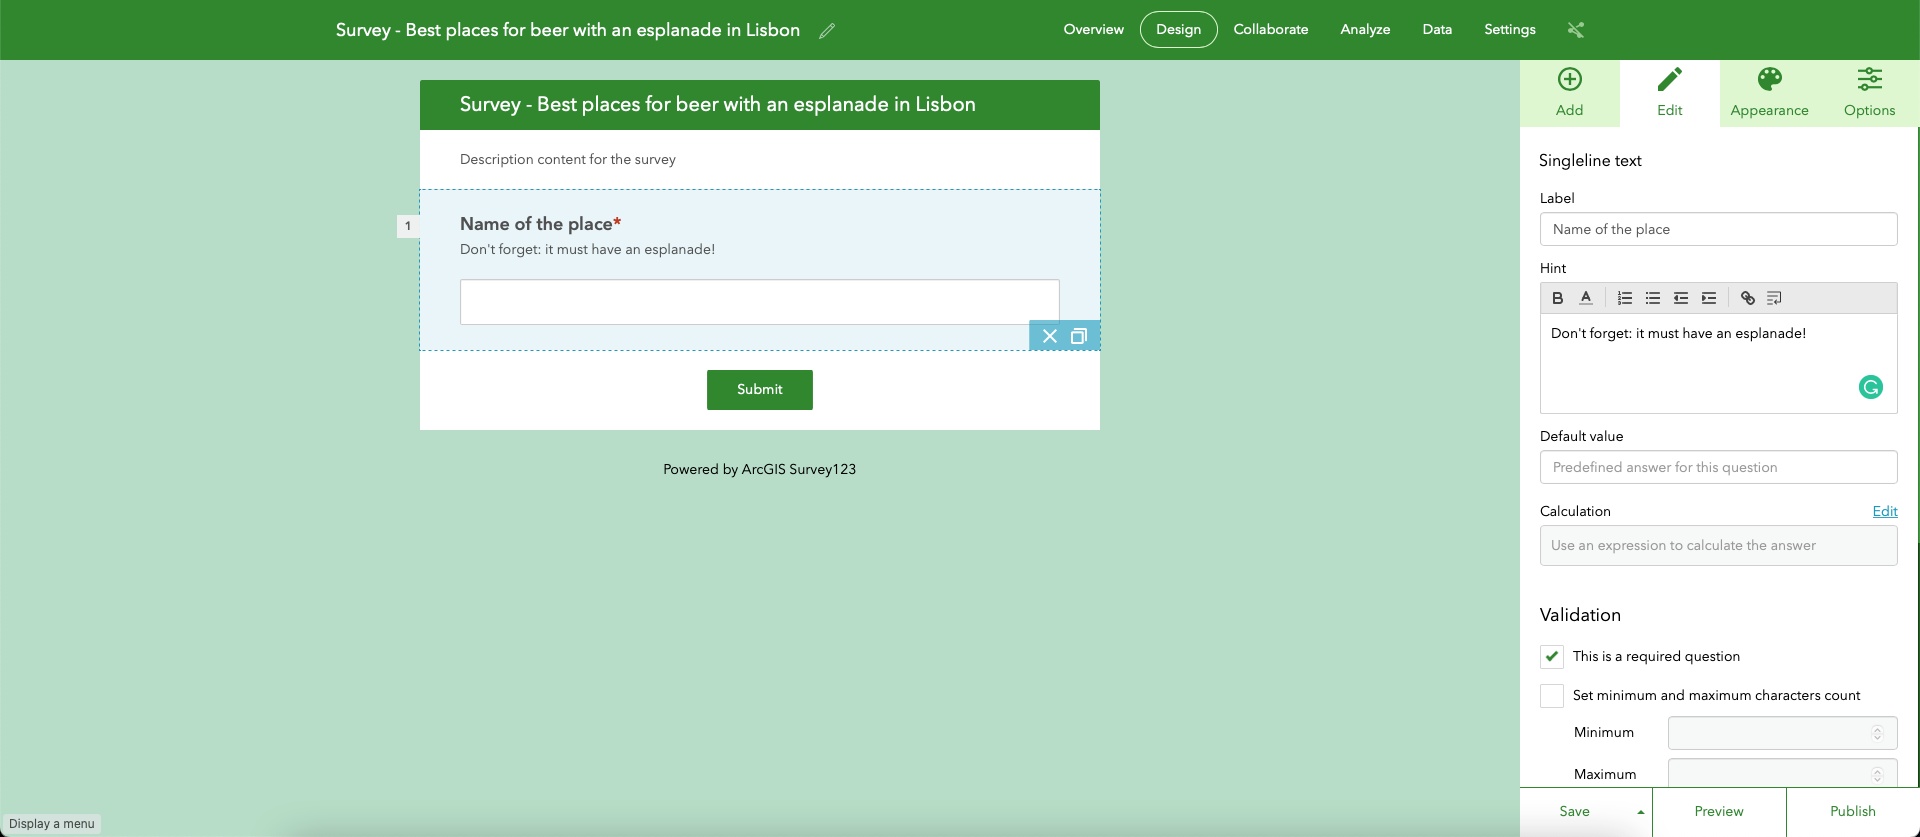
In the Edit tab, add a Label ('Name of the place') and a Hint (something that will clarify the question, when needed). Finally, tick the This is a required question checkbox.
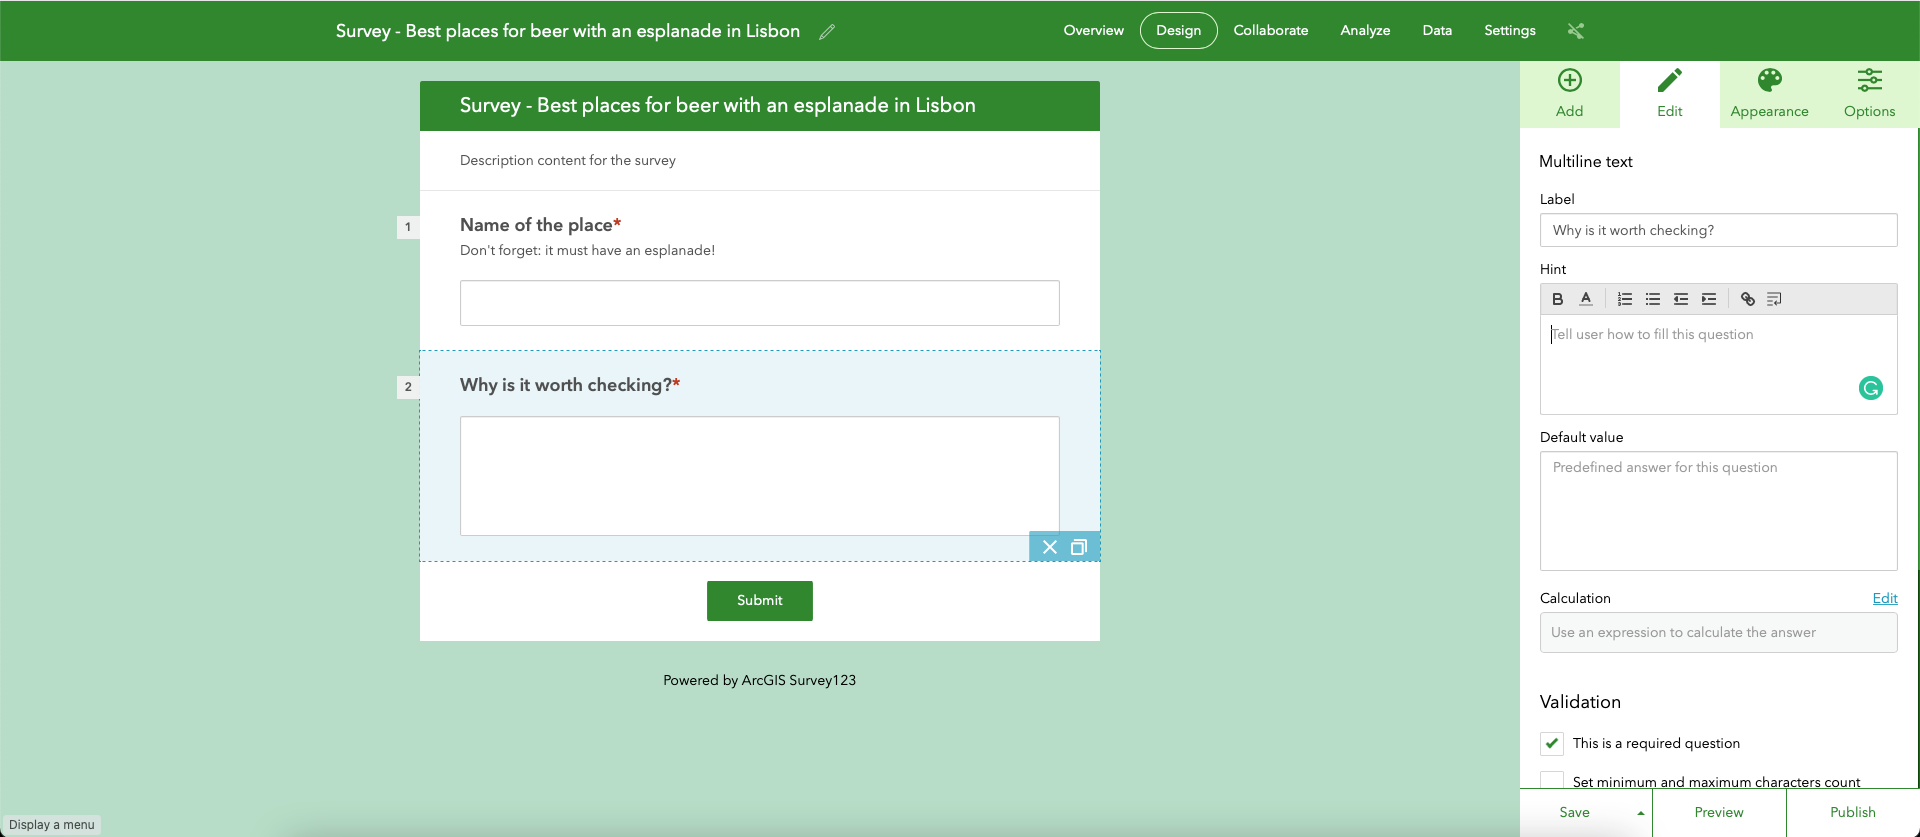
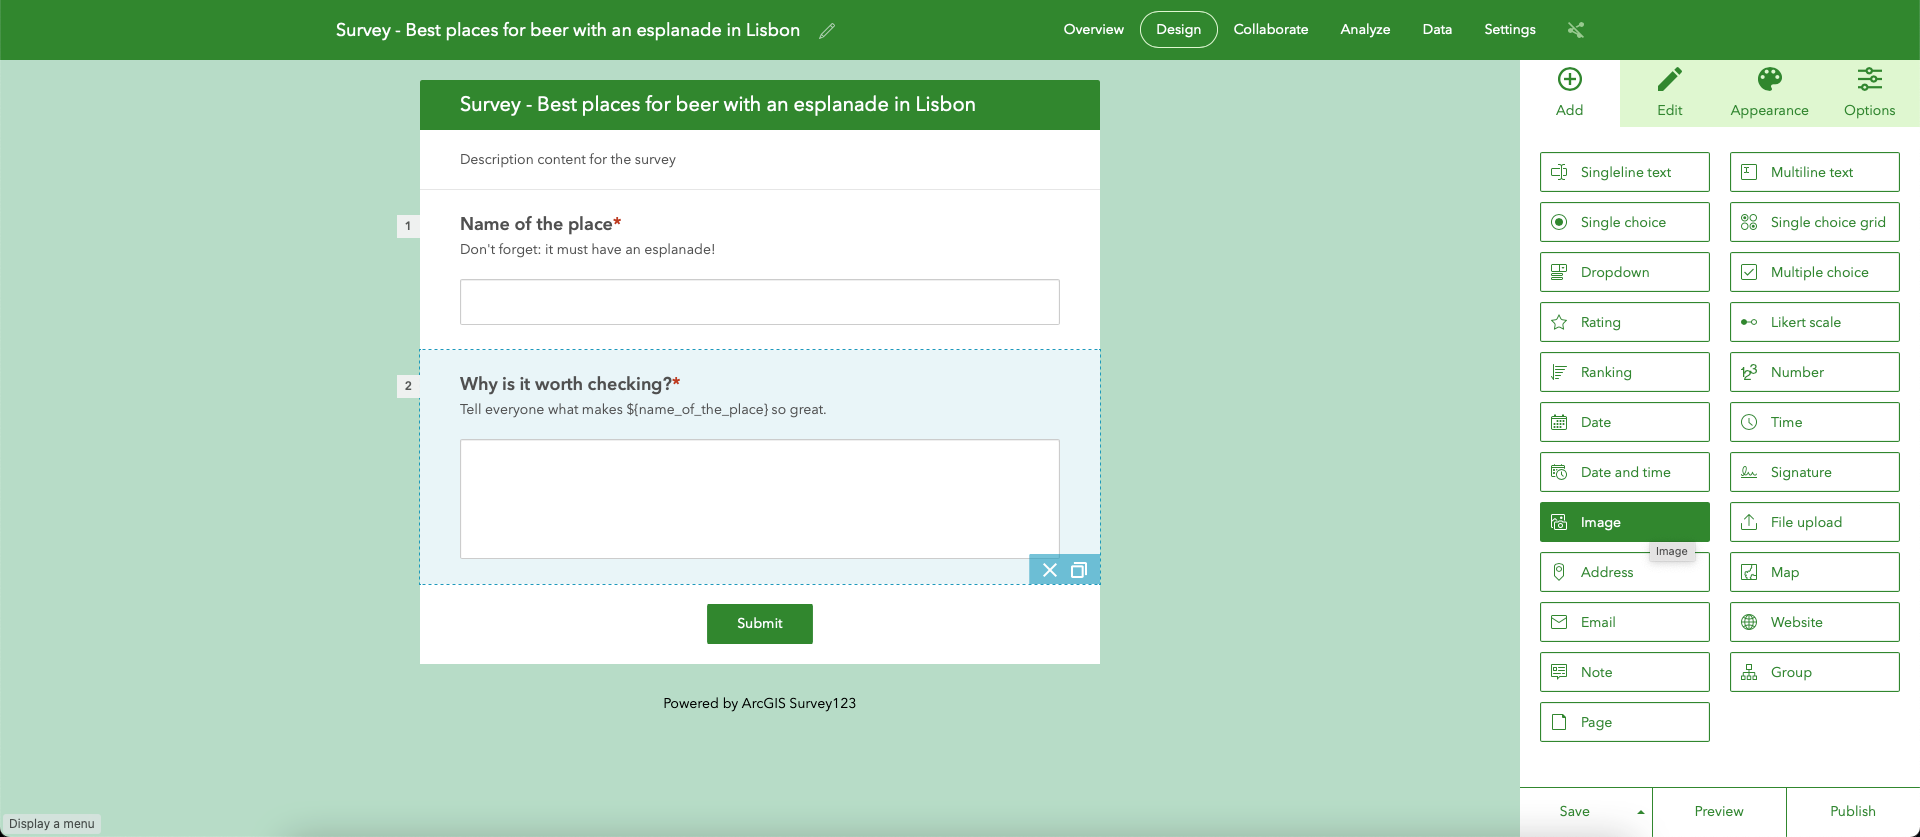
Go back to the Add tab and choose Multiline text.
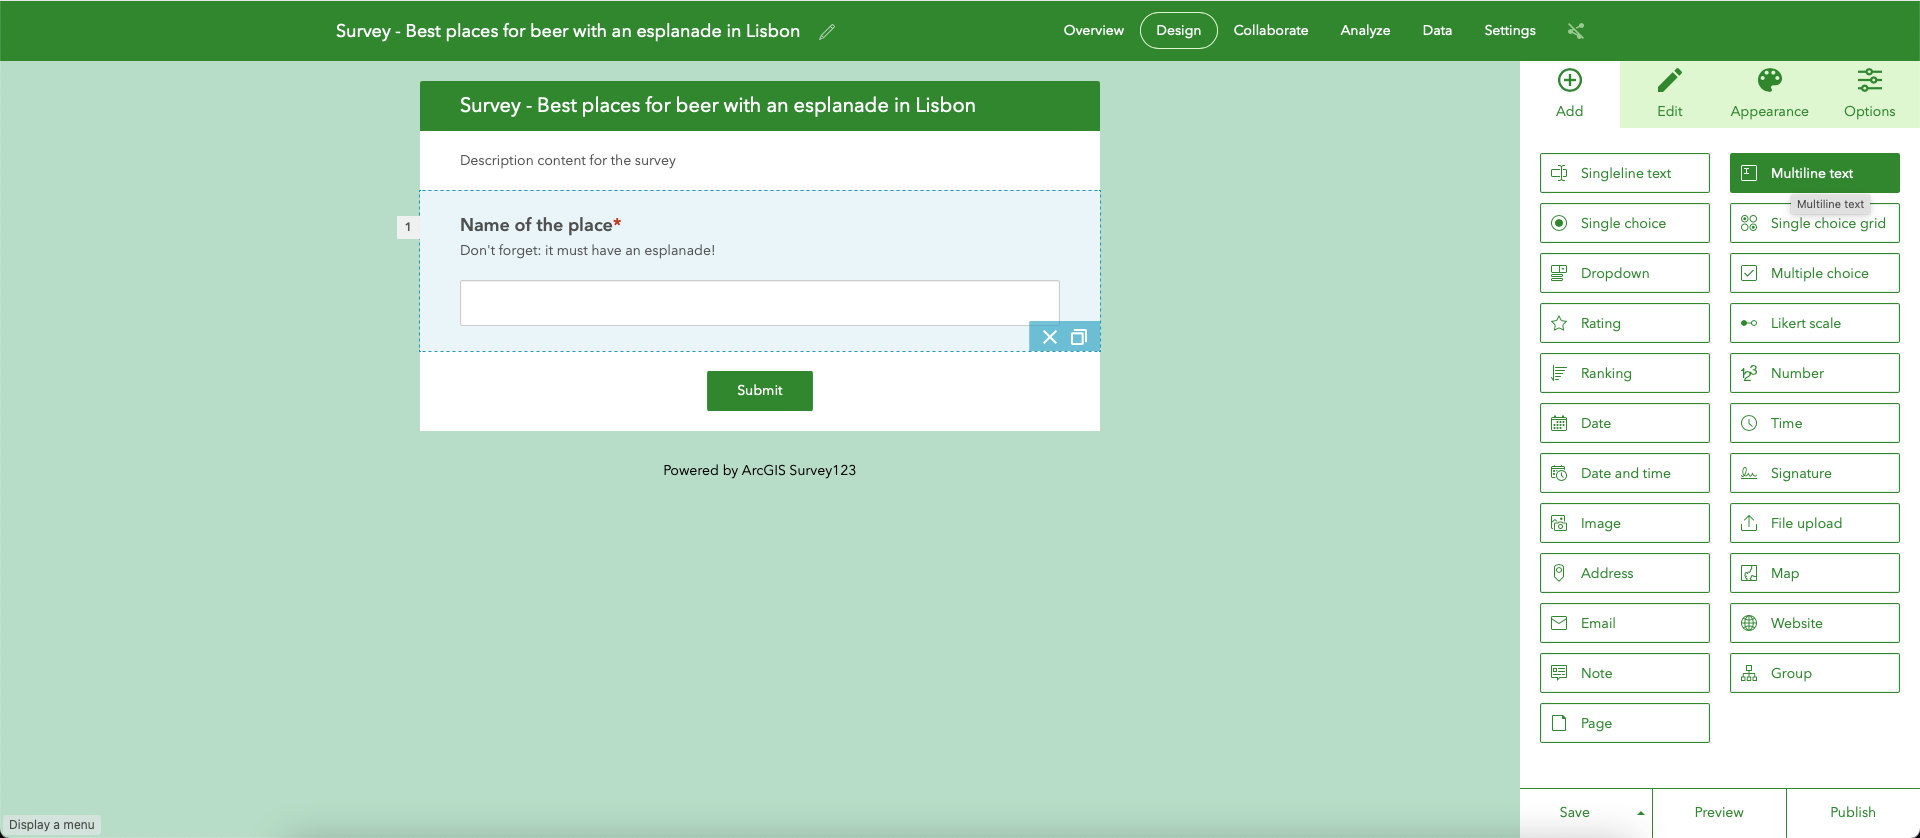
In the Edit tab, add a Label ('Why is it worth checking?') like so:
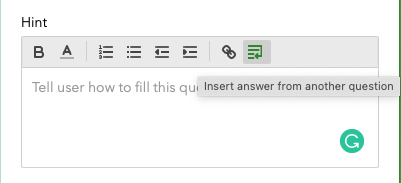
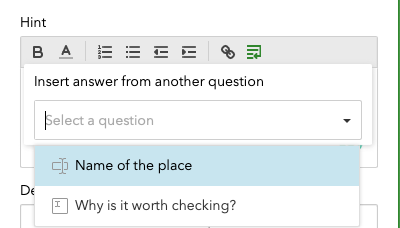
Let's now focus on the Hint section. Notice the last button, Insert answer from another question. Click on it; you'll be able to insert the place's name entered by the responder in the first question.
Choose the first question in the drop-down.
Complete the hint with the following text:
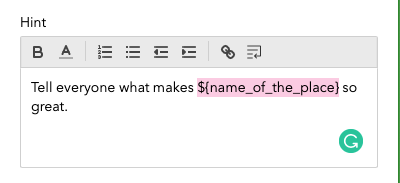
Before proceeding, copy '${name_of_the_place}' and have it handy. You'll use it in the following questions.
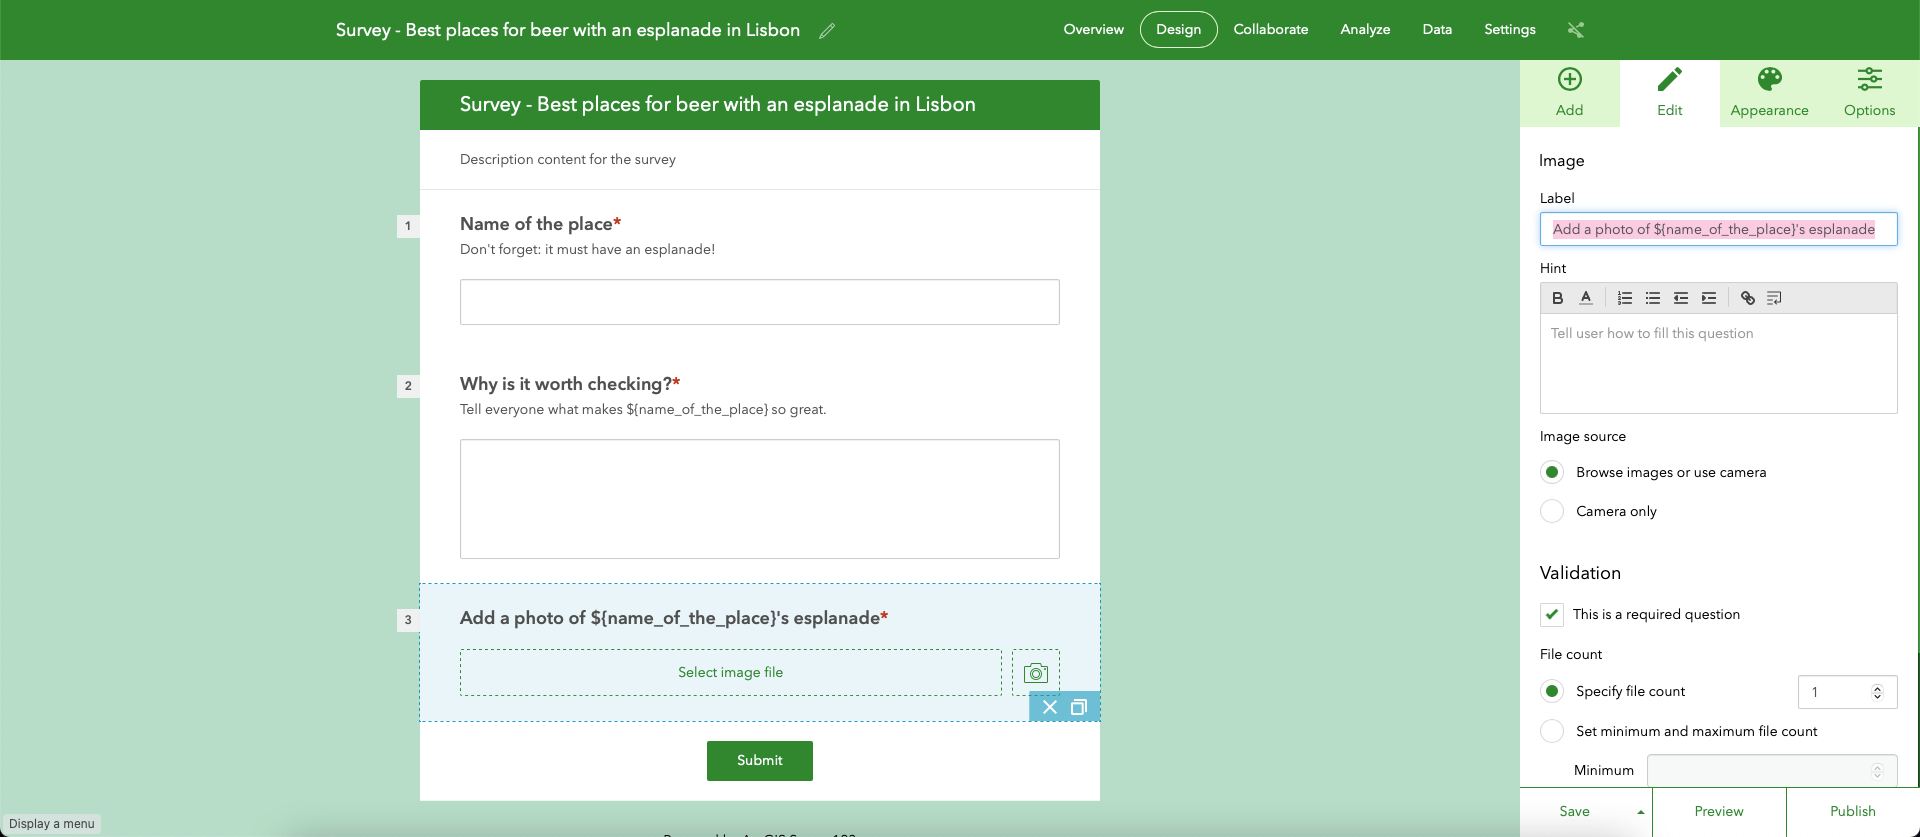
Return to the Add tab and choose Image.
In the Edit tab, under Label, enter the following text (including the particle you copied earlier):
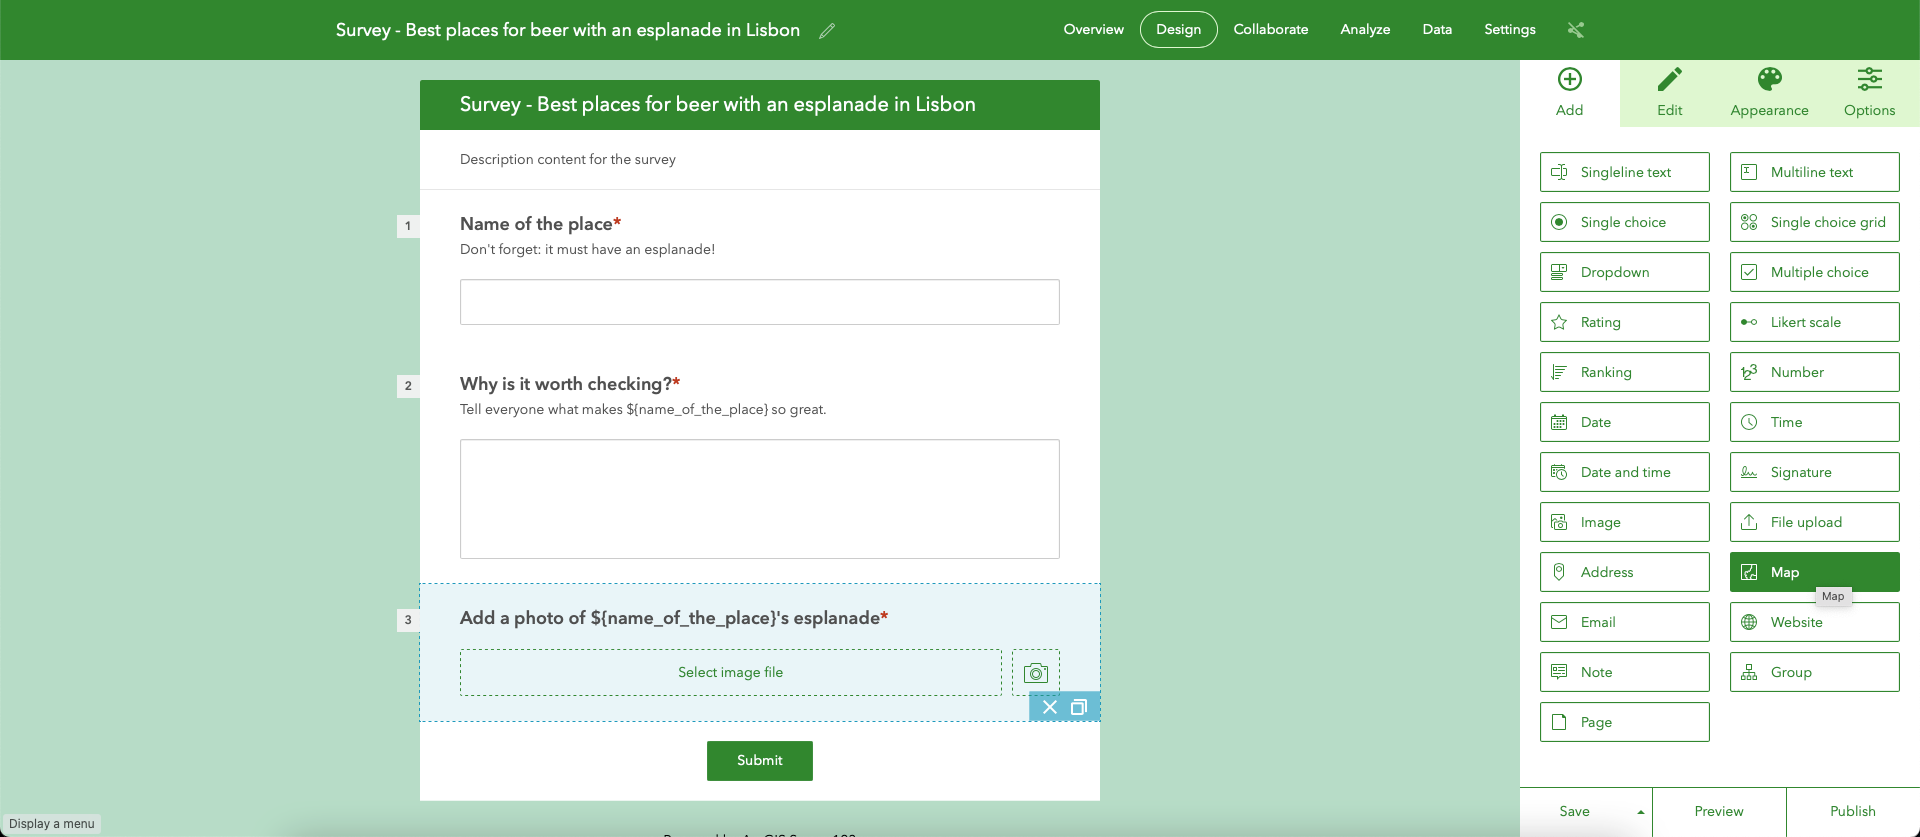
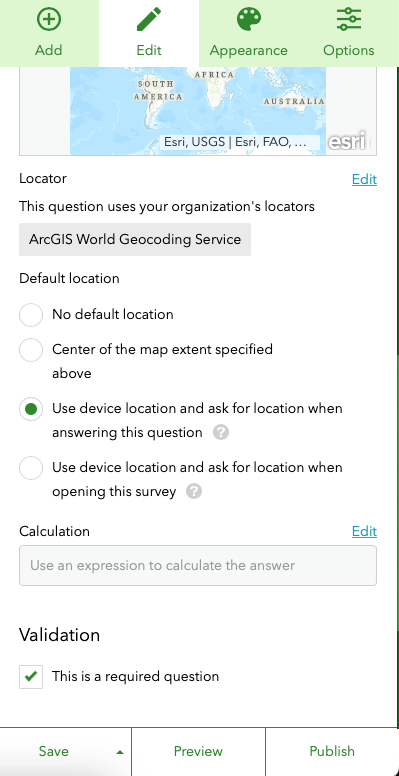
Go back to the Add tab again and choose Map.
In the Edit tab, enter the Label and Hint text like so:
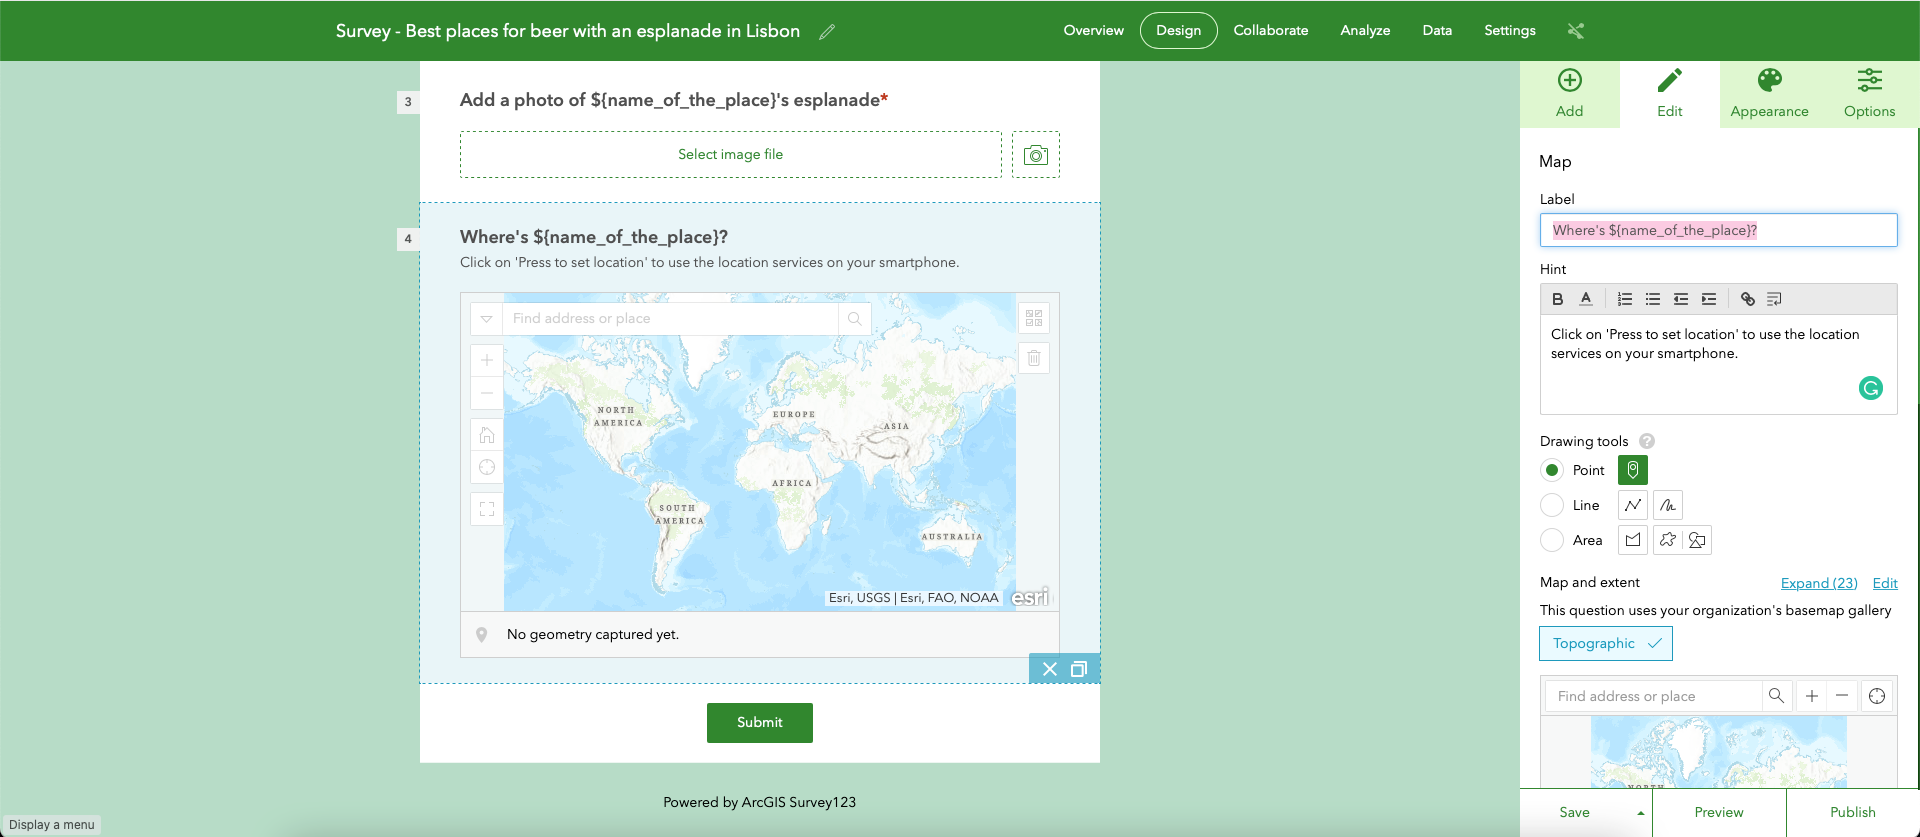
In Default location, choose Use device location and ask for location when answering this question.
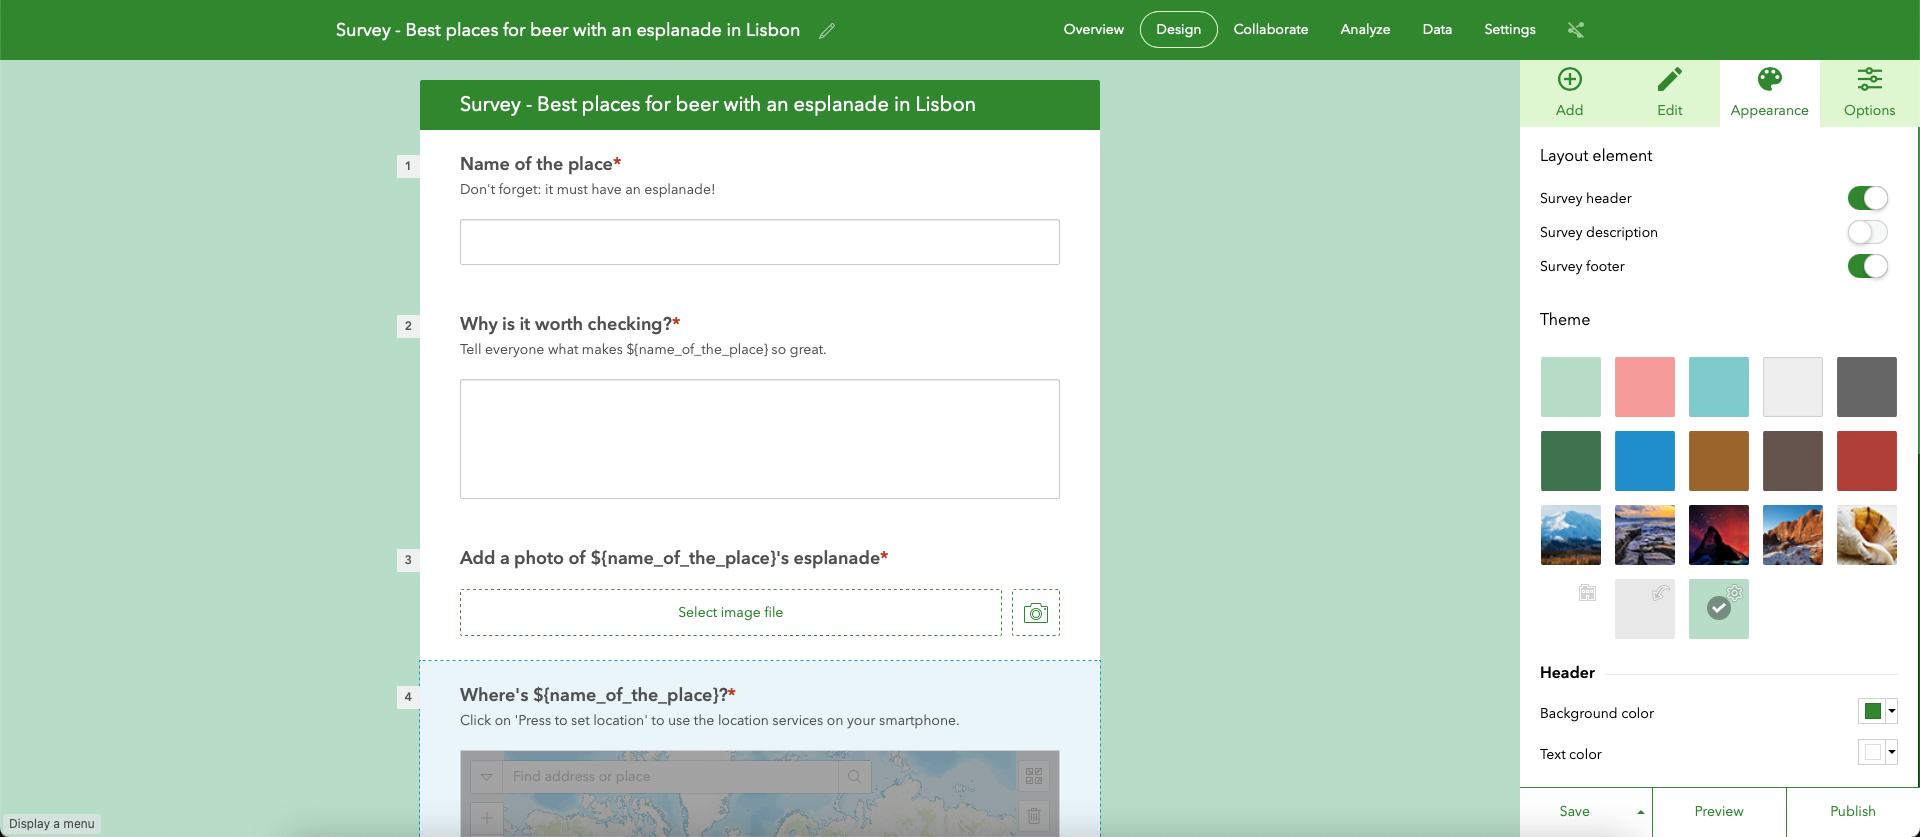
Now that we have defined all questions in the form let's move on to the Appearance tab. Disable Survey description.
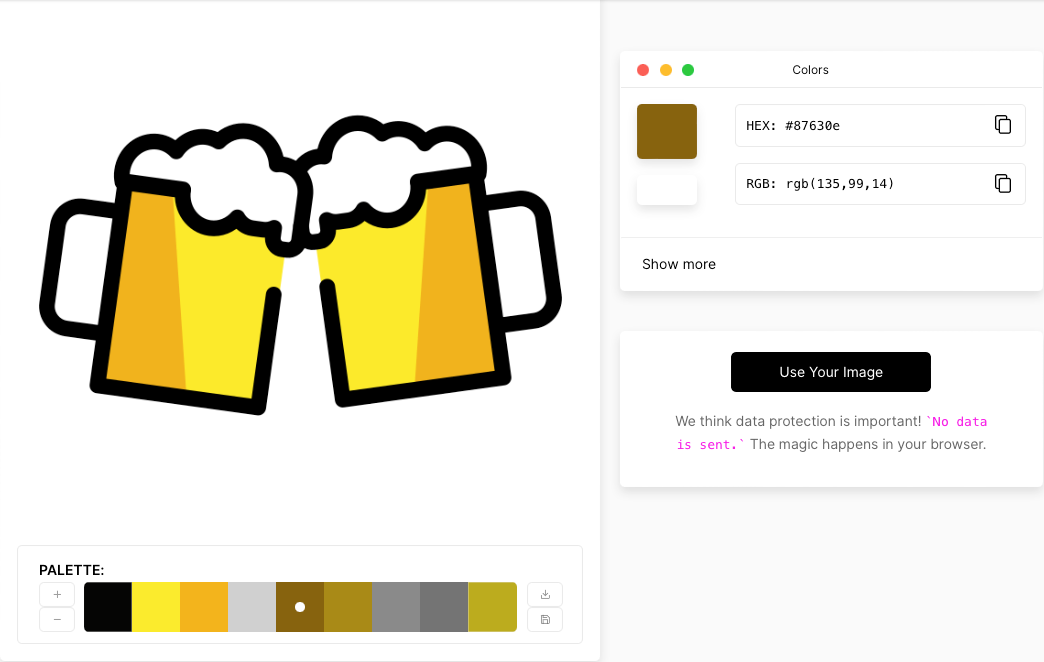
We are now going to customise the theme colours. To harmonise all colours across the survey (and the story map), let's get the HEX from the beer emoji we used earlier. To do so, head to the https://imagecolorpicker.com website and click on Use Your Image.
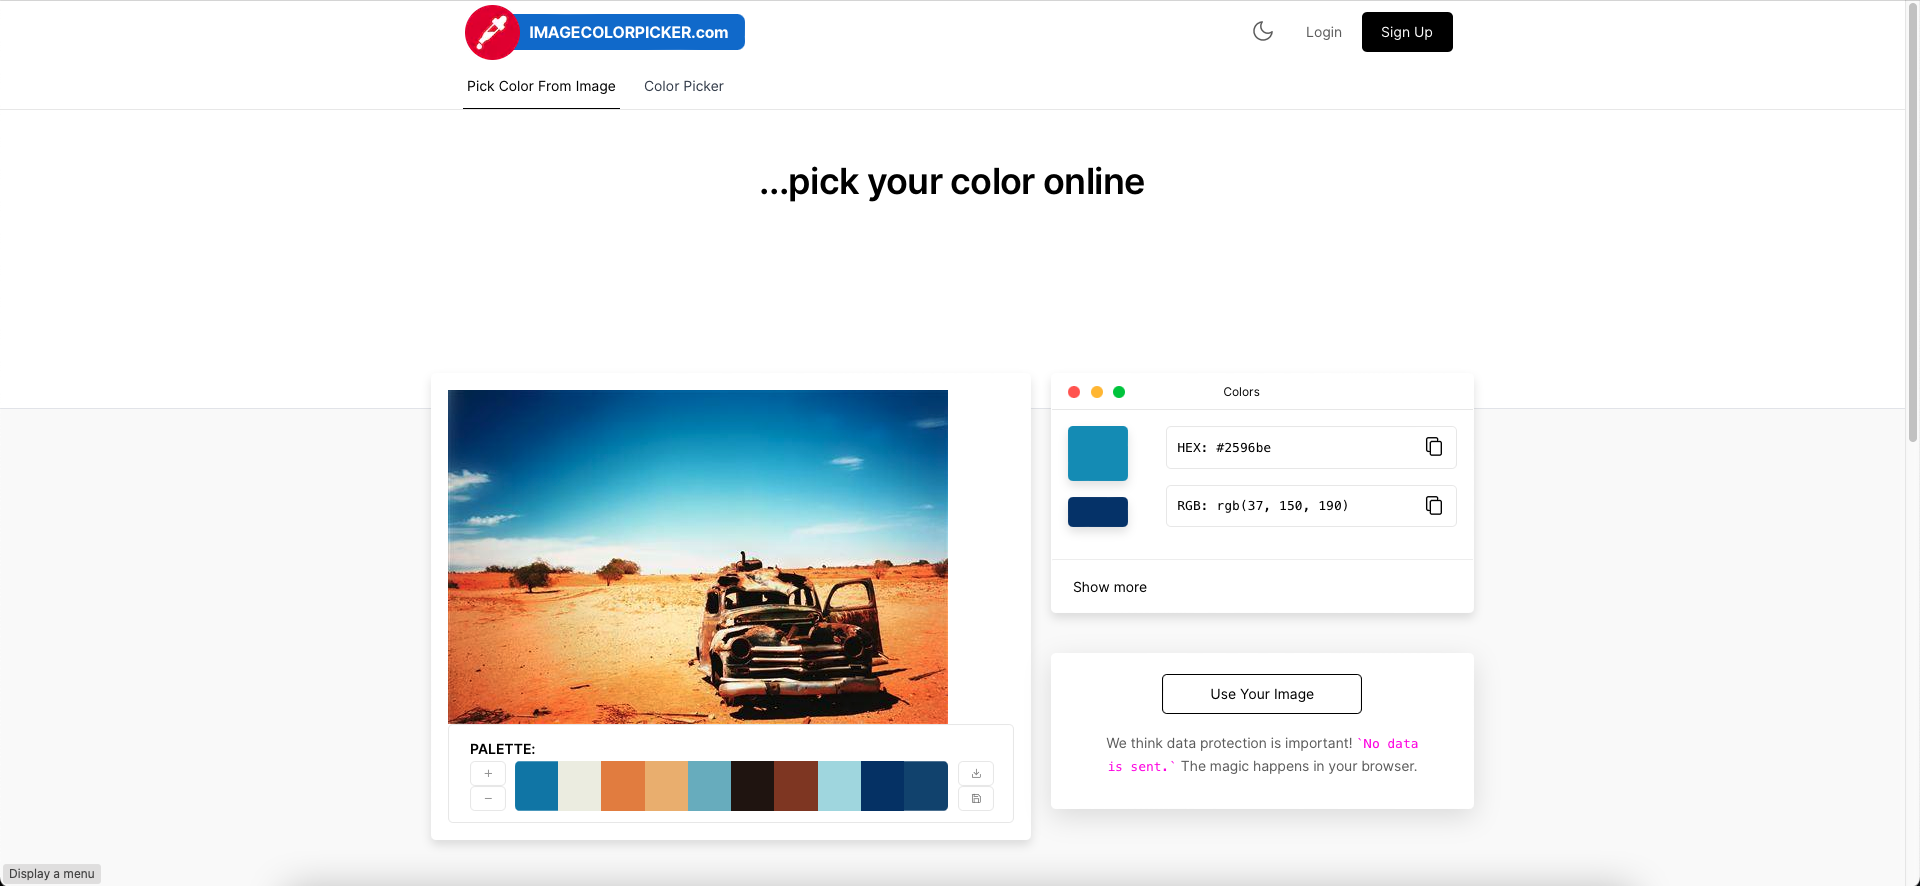
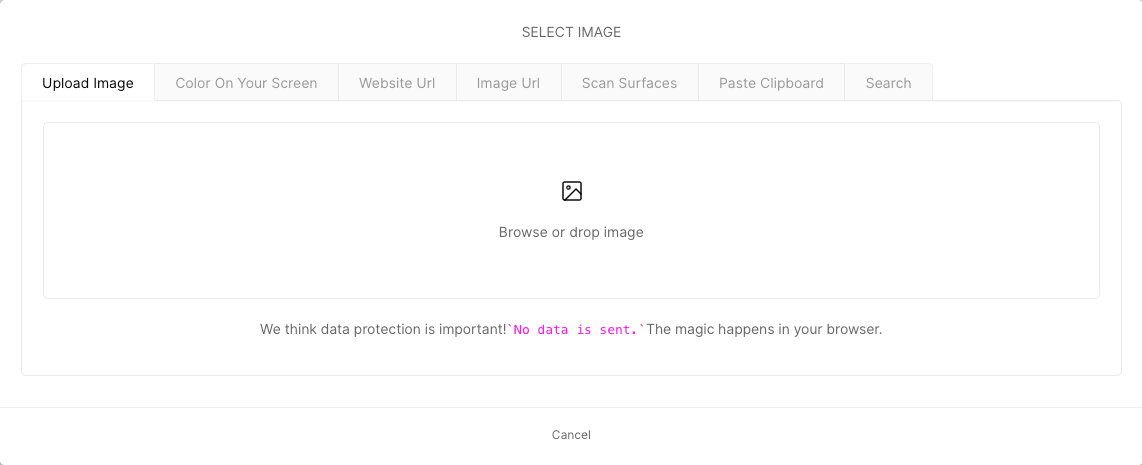
Choose Upload Image and find the beer emoji from your computer.
Now click on the brown in the colour palette and copy the HEX code (without the #): '87630e'.
Without closing that page, go back to the survey and under Header, Background color, enter the HEX code you copied earlier.
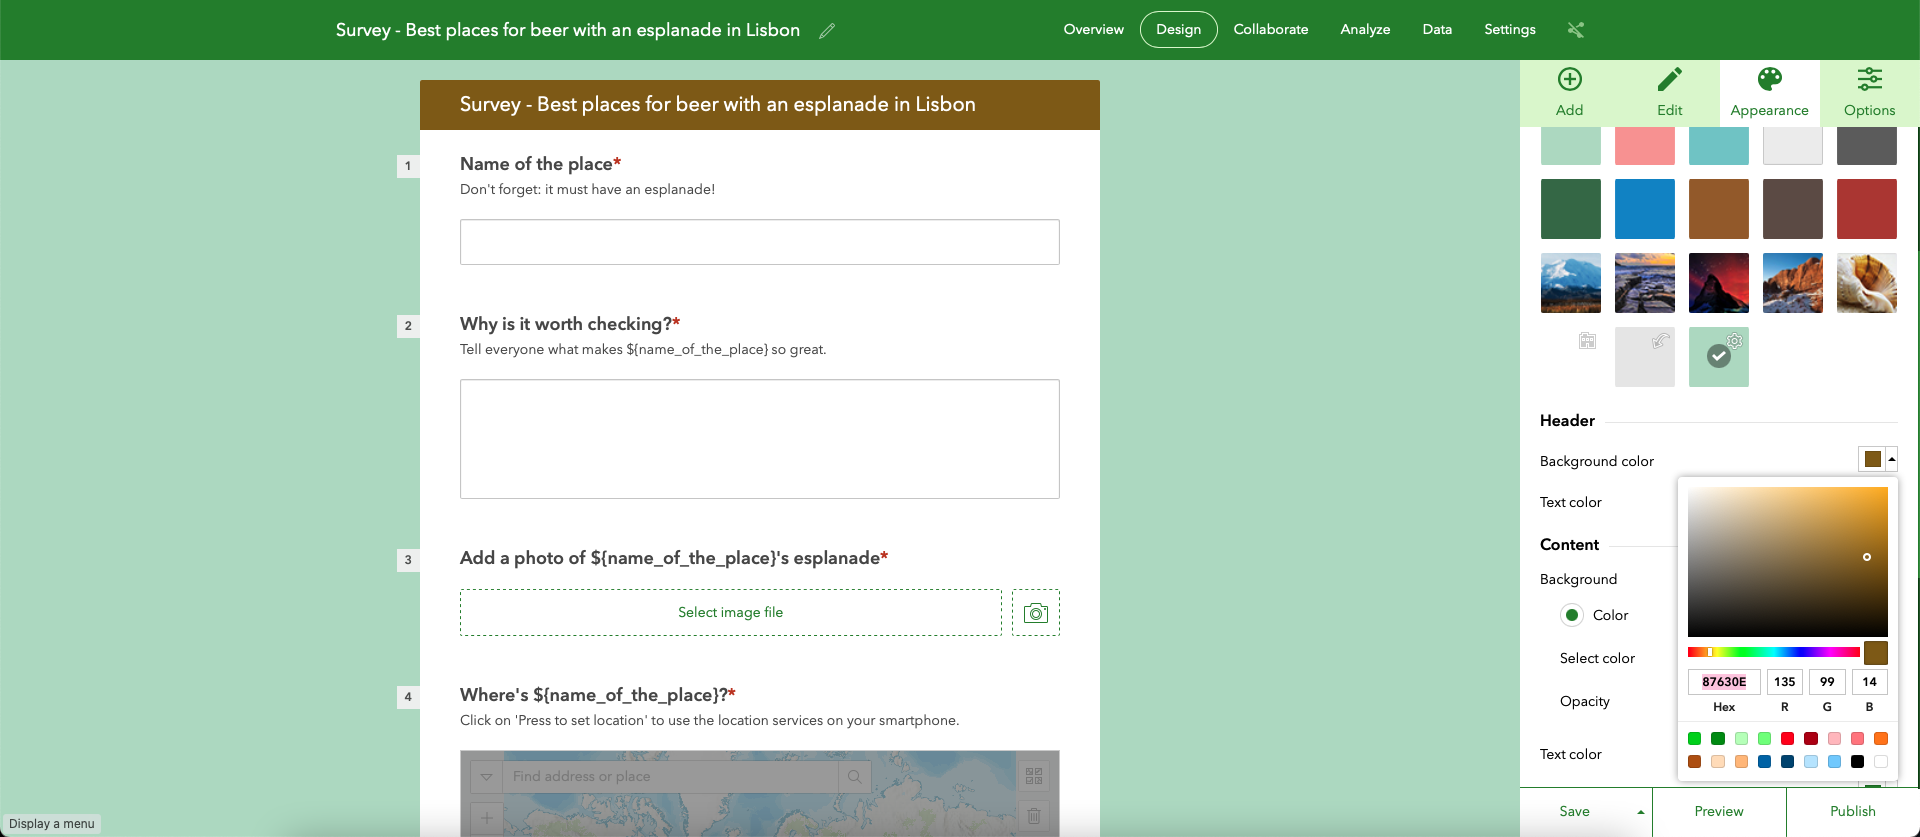
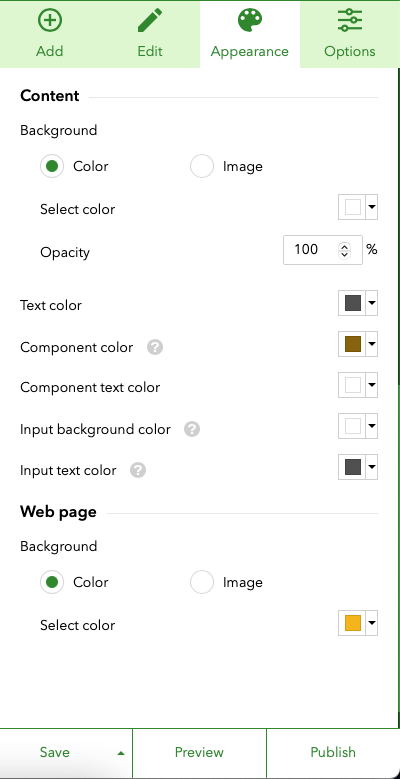
Under Content, change the Component color to the same HEX: '87630e'.
Now head back to the image colour picker website. Click on the orange colour in the palette and copy the HEX code: 'f3b41c'.
Without closing that page, go back to the survey and, under Web page, change the Background colour to orange.
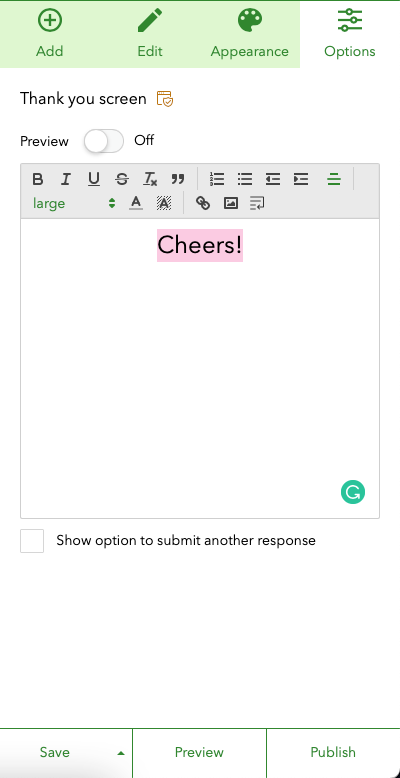
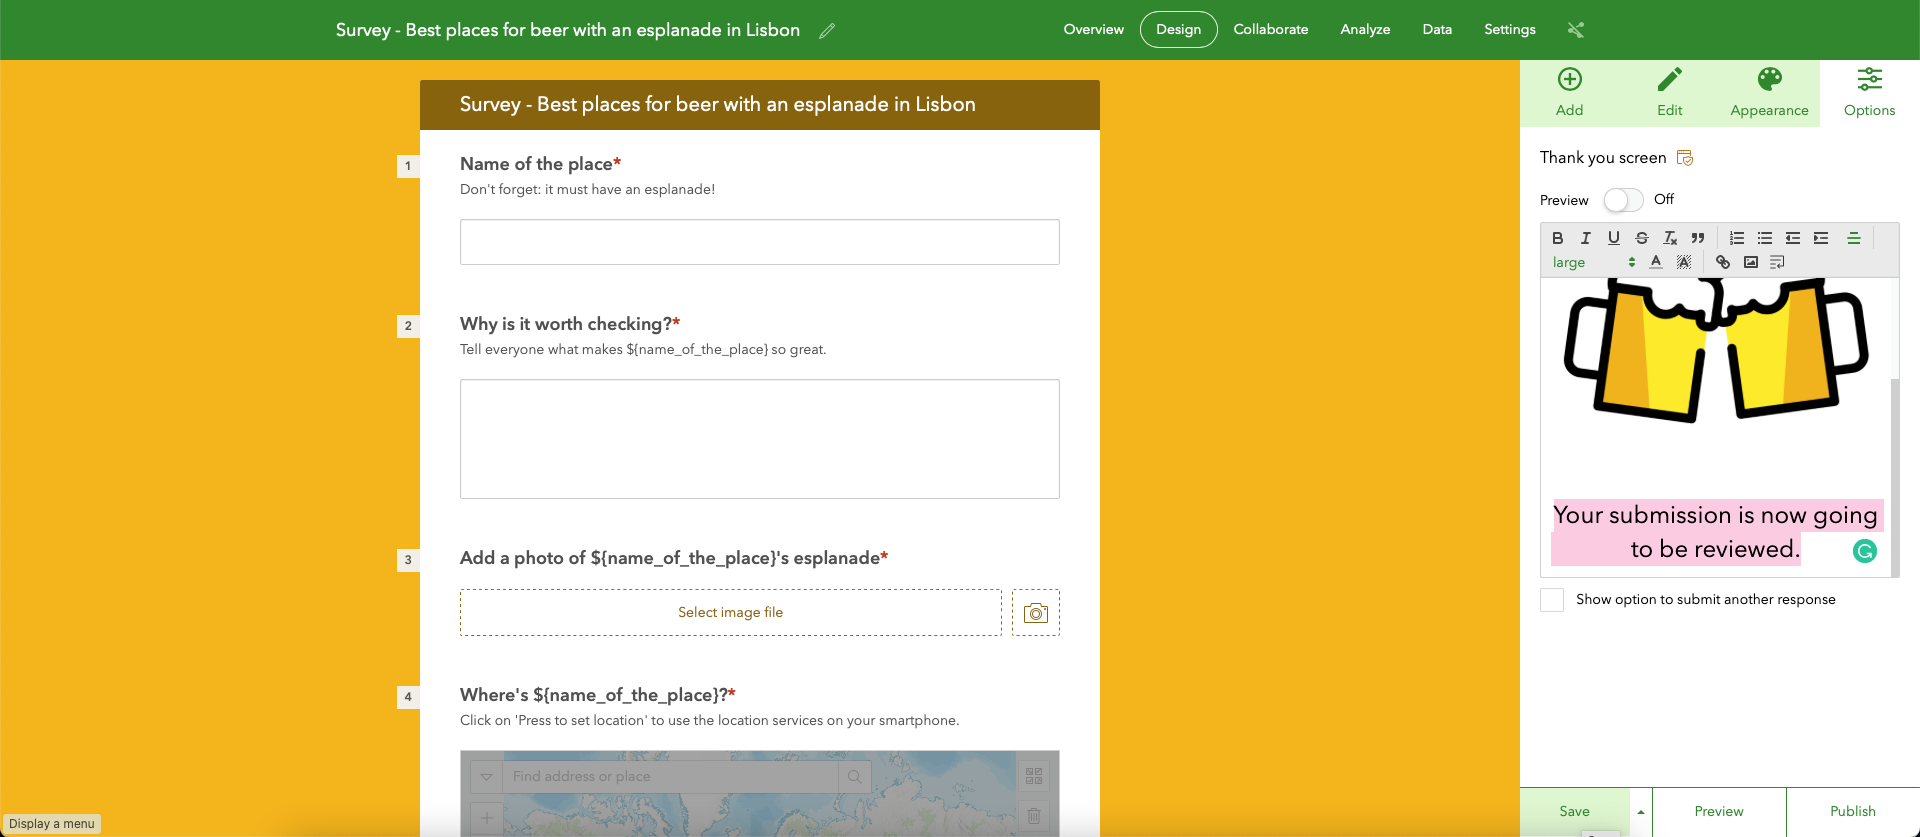
Let's now move on to the last tab, Options. Here, you'll customise what the respondents see after their submission.
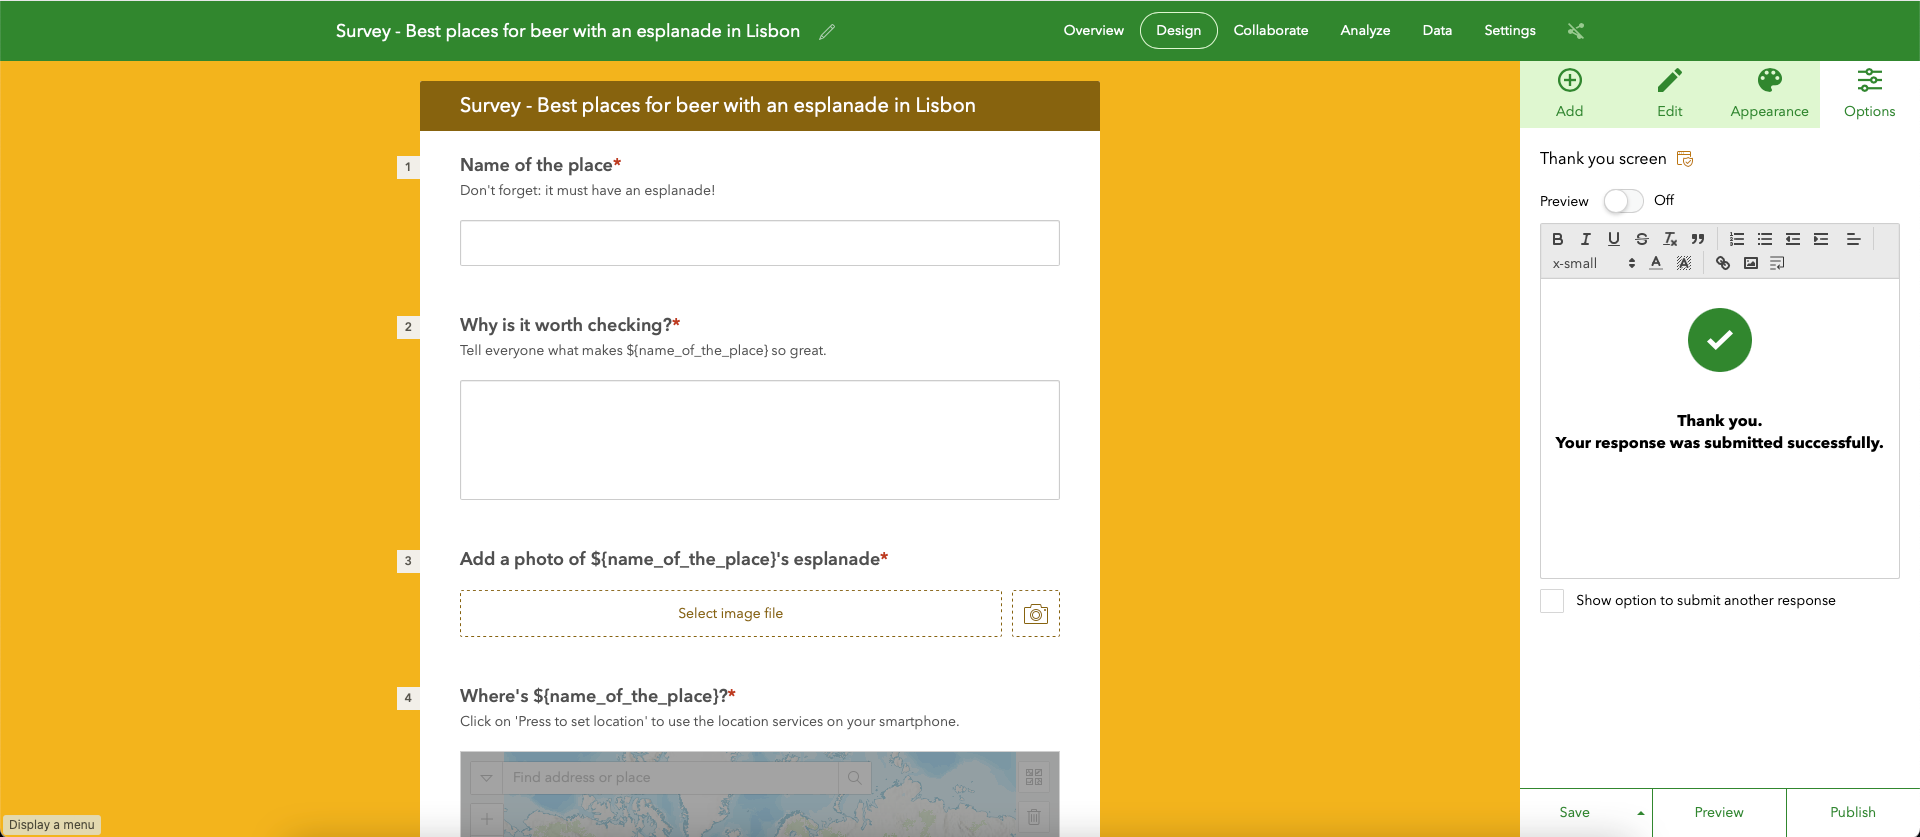
Delete the existing content and write 'Cheers' in large.
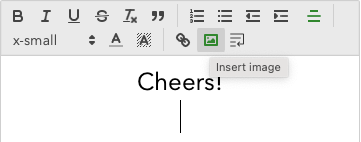
Now click on the Insert image button.
Choose Upload image and retrieve the beer emoji (from earlier) from your computer.
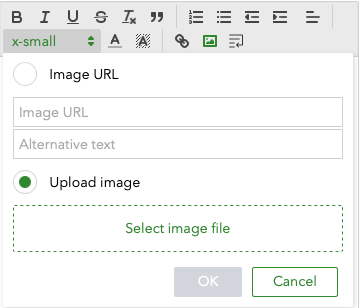
Then, click OK.
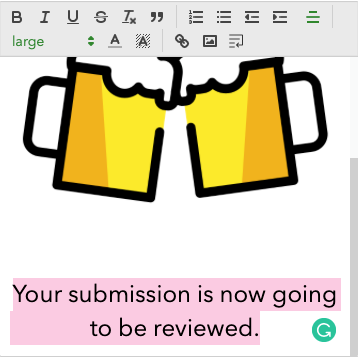
Finally, add the following text (in large): 'Your submission is now going to be reviewed'.
Hit Save.
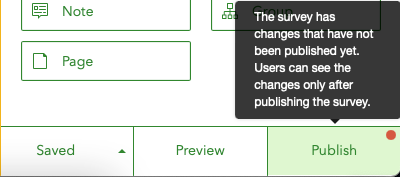
Now that we finished setting up the survey, we are ready to publish and share it with the world. Hit Publish.
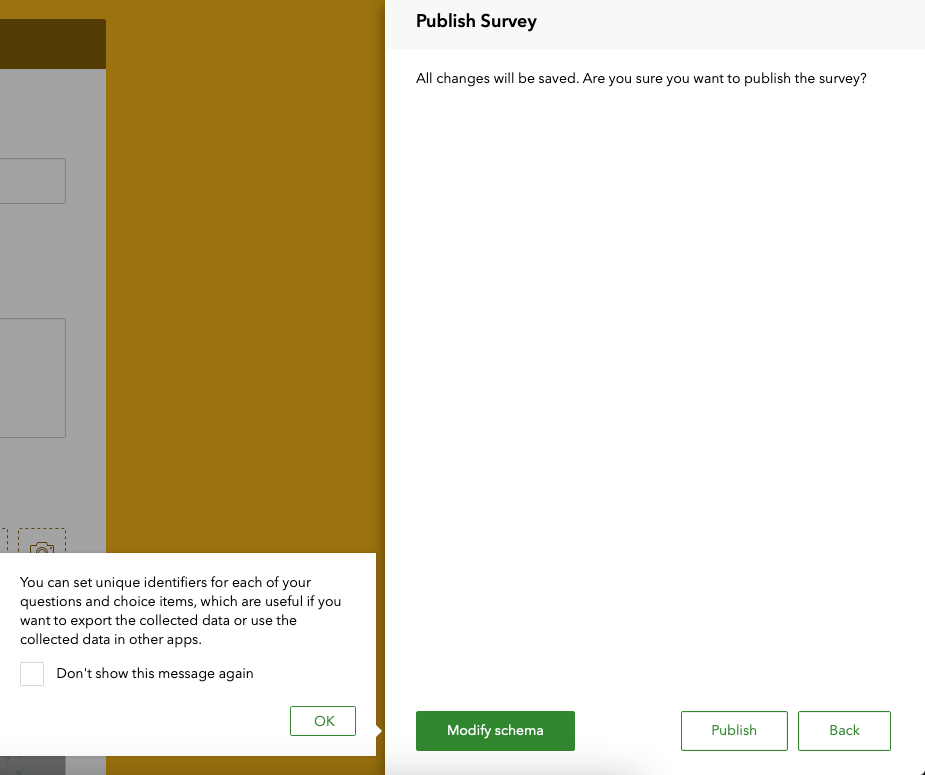
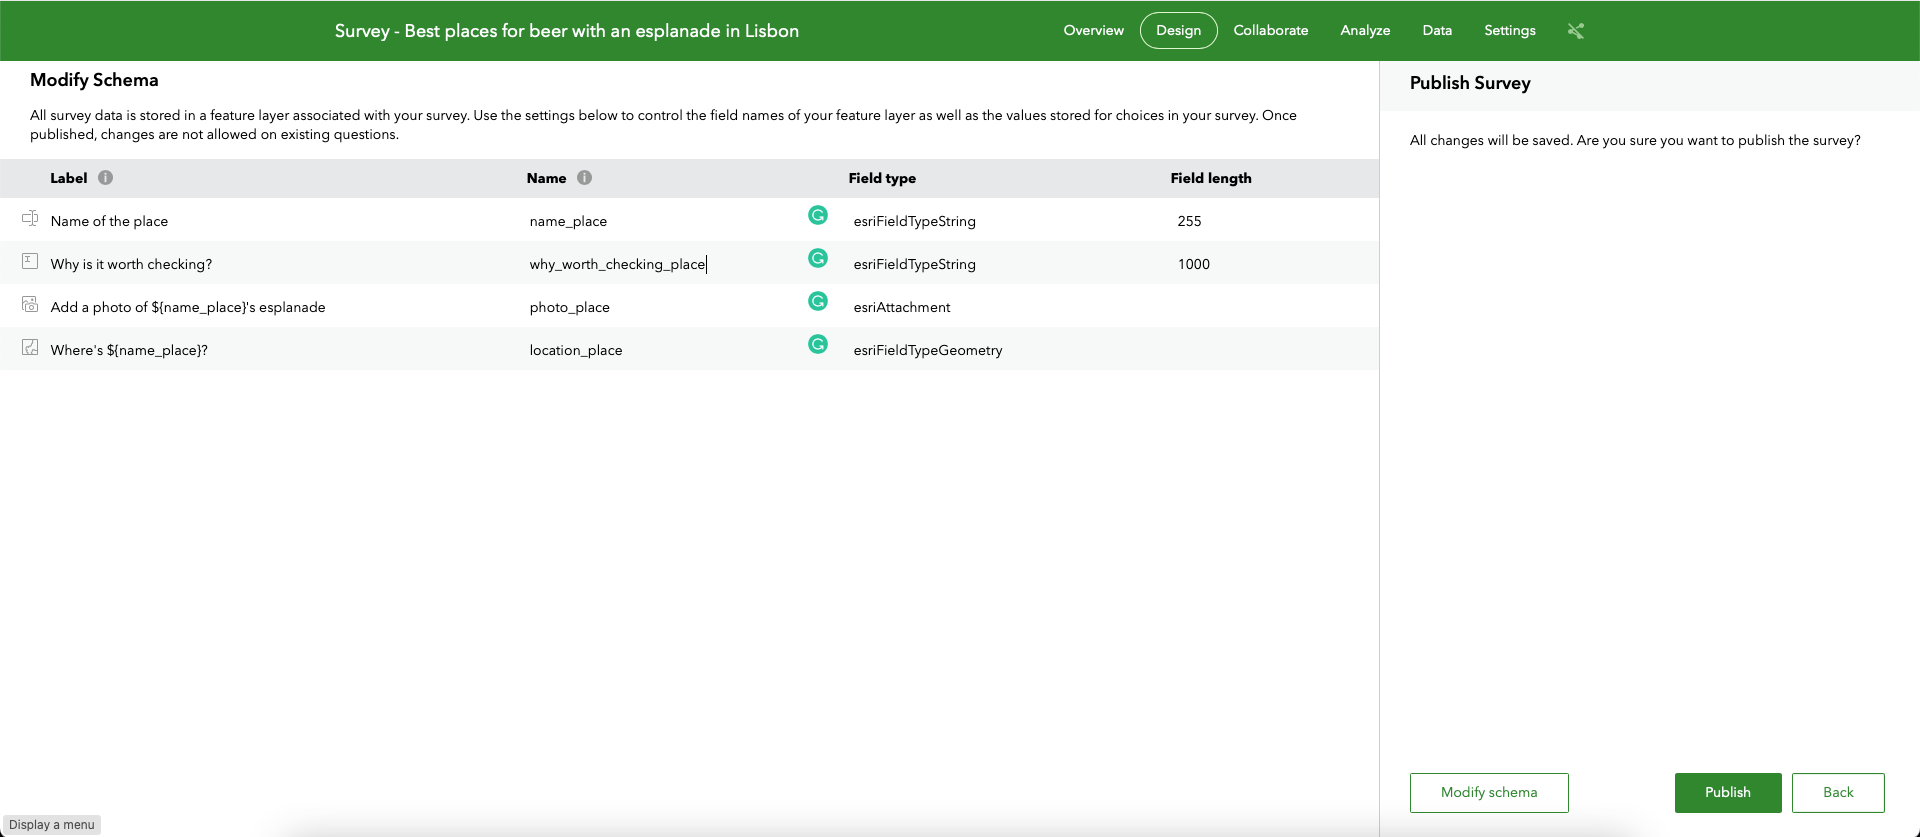
You are now given the option to Modify schema. This will allow you to customise the field name for each form question.
Feel free to change the field names as desired. Once you're done, hit Publish.
In Collaborate, Who can submit to this survey, tick the option Everyone (public). This is necessary to allow the wider public to submit answers to your survey questions. Hit Save.
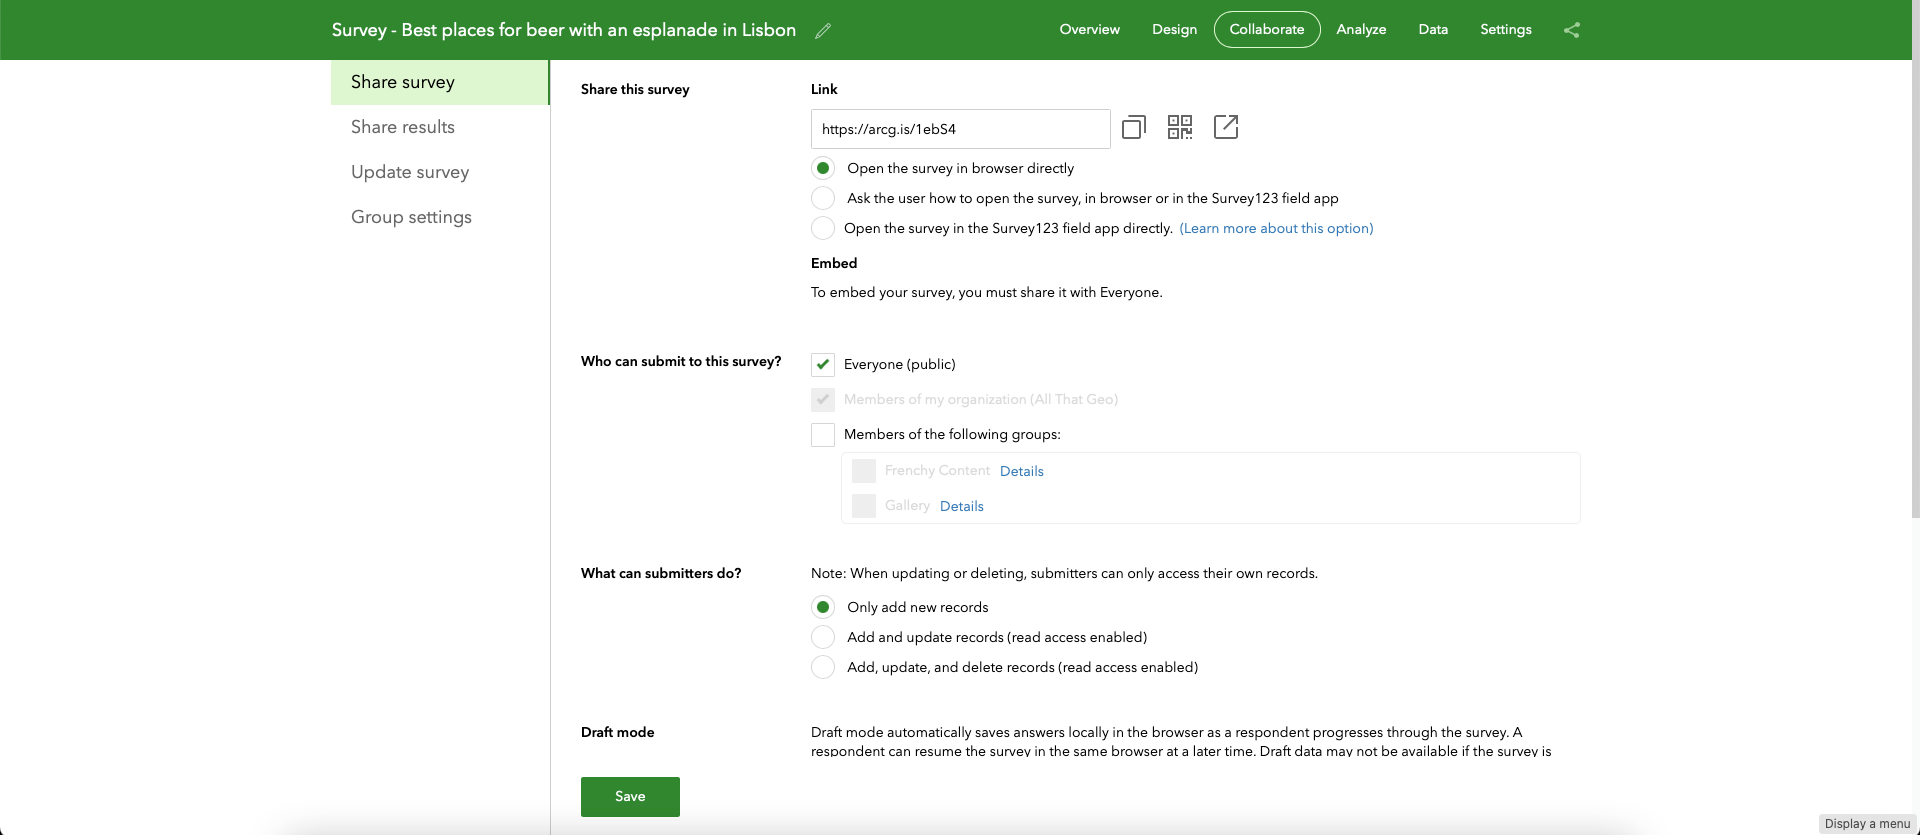
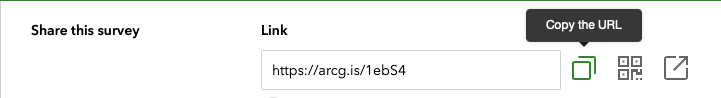
Now Copy the URL. This is the URL you need to embed in the story map later. Save it somewhere and keep it handy.
2.2 Add a vetting field to your survey data model
To prevent inappropriate submissions from showing on the map, we will add a hidden field to the survey. The idea is that all new entries get a default value in the Validated field as they arrive. Then, after reviewing and having changed that value, the entry will show in the map tour.
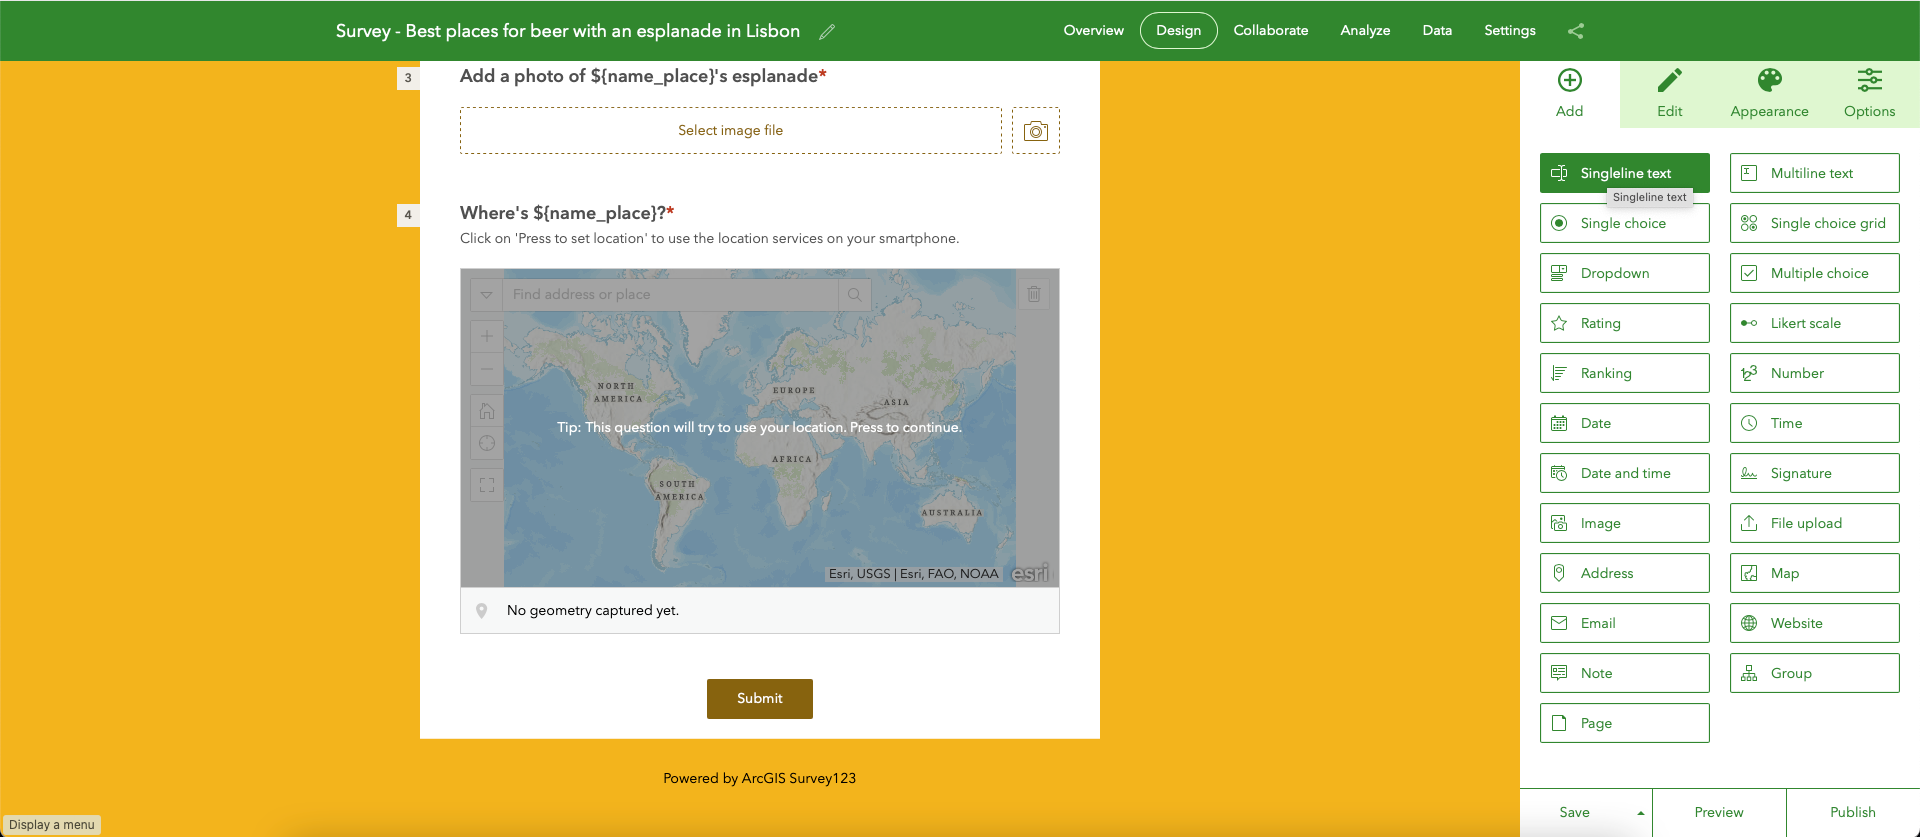
Go back to Design and choose Singleline text.
In the Edit tab, enter a Label ('Validated?'), a default value ('N', as in, not yet validated), leaving the This is a required question box unchecked.
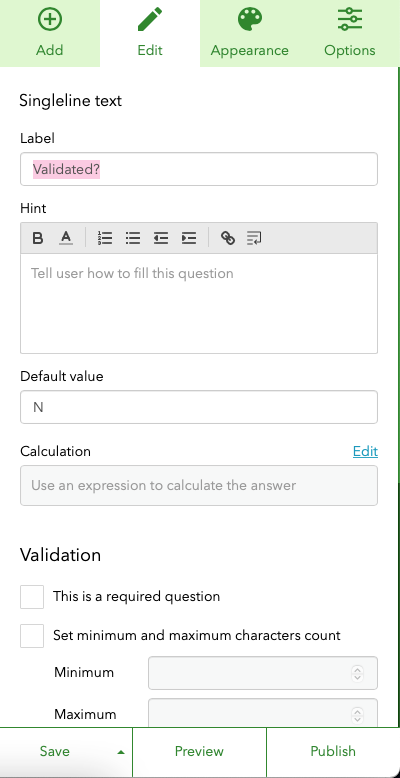
Further down, tick the Hide from survey checkbox.
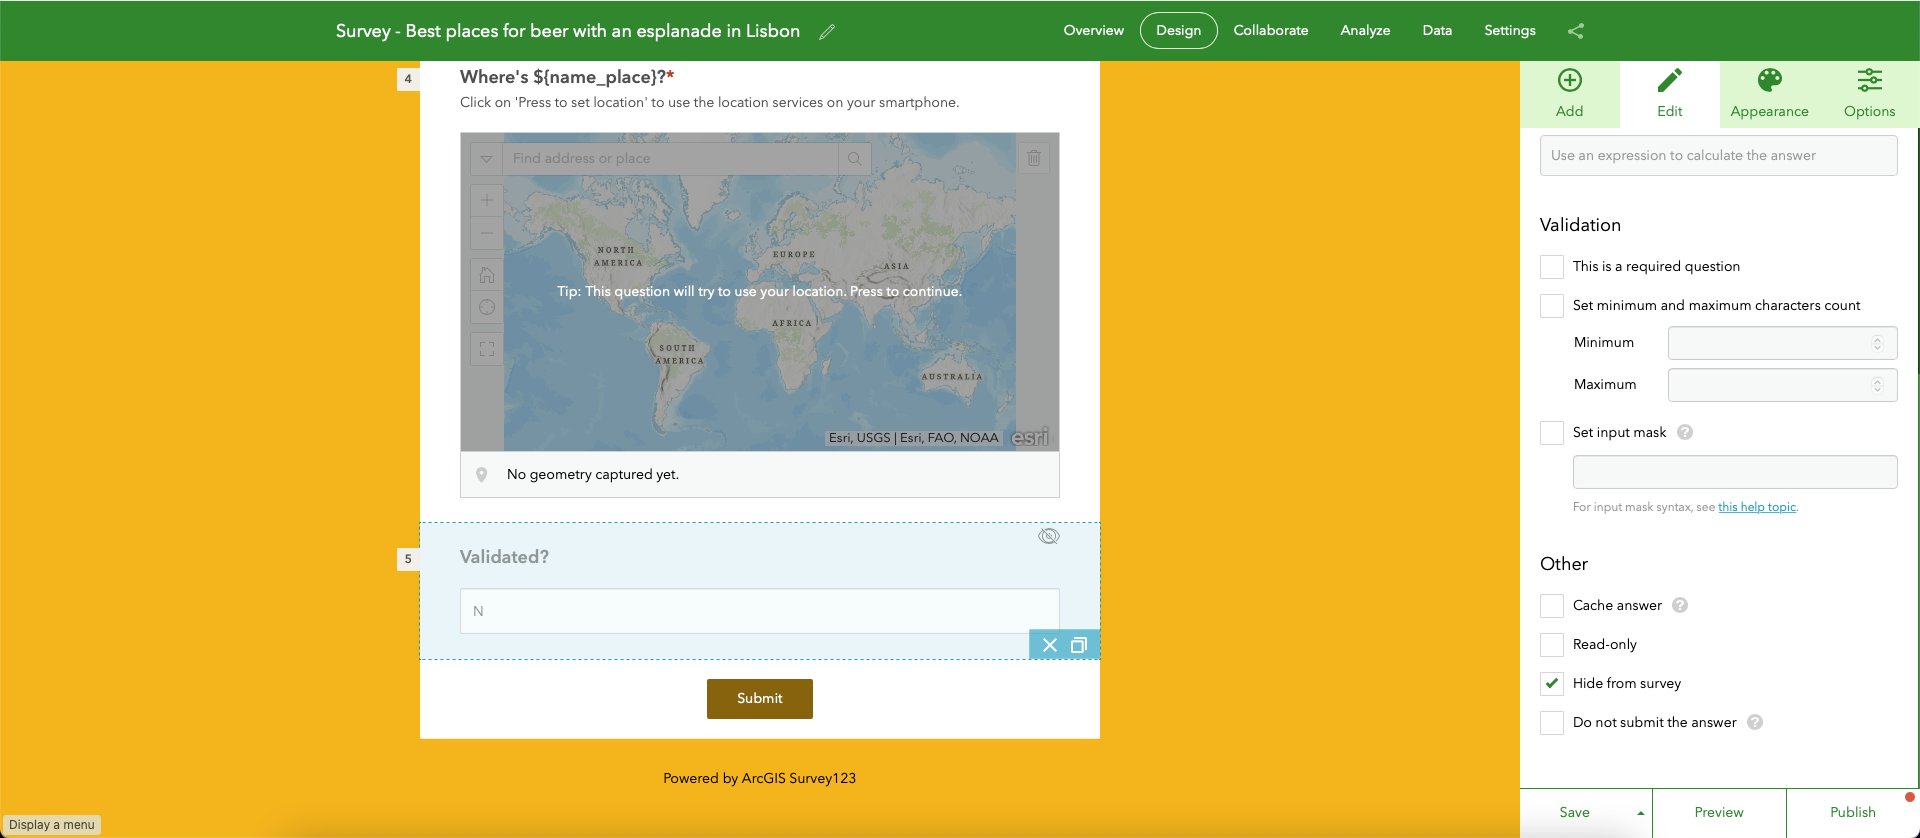
This question will not be shown to respondents, but it will be automatically added with the answer 'N' as soon as the form is submitted.
Hit Publish and Publish again. Leave the page open.
2.3 Submit a dummy record to the survey
You will now create a dummy submission to:
- set up a filter that will prevent inappropriate entries from showing before you vet them
- test that filter
- add the map tour to the story map
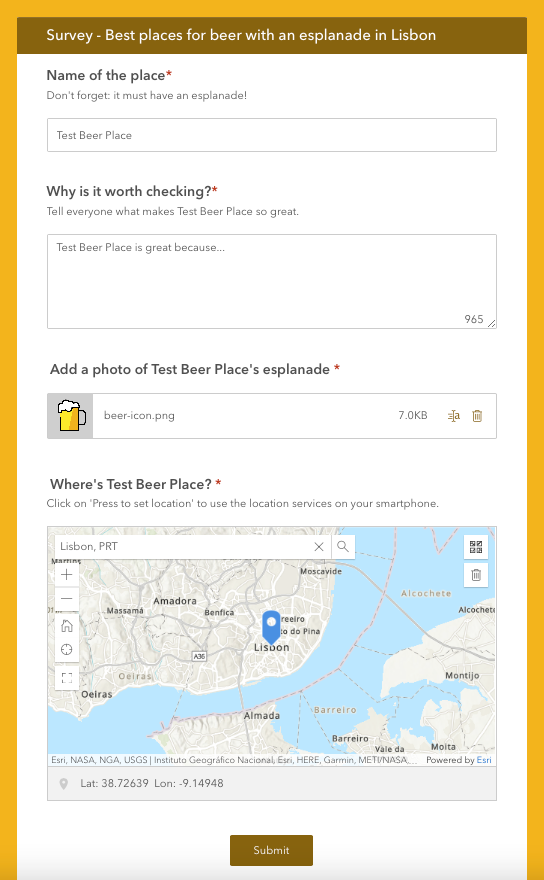
To create a dummy submission, open the survey URL from earlier in a different window of your browser and fill out the form. When you're done, click on Submit and close the window.
2.4 Update a view to filter survey records
We now want to filter the survey results to exclude the unverified ones, as defined in the Validated question in the survey.
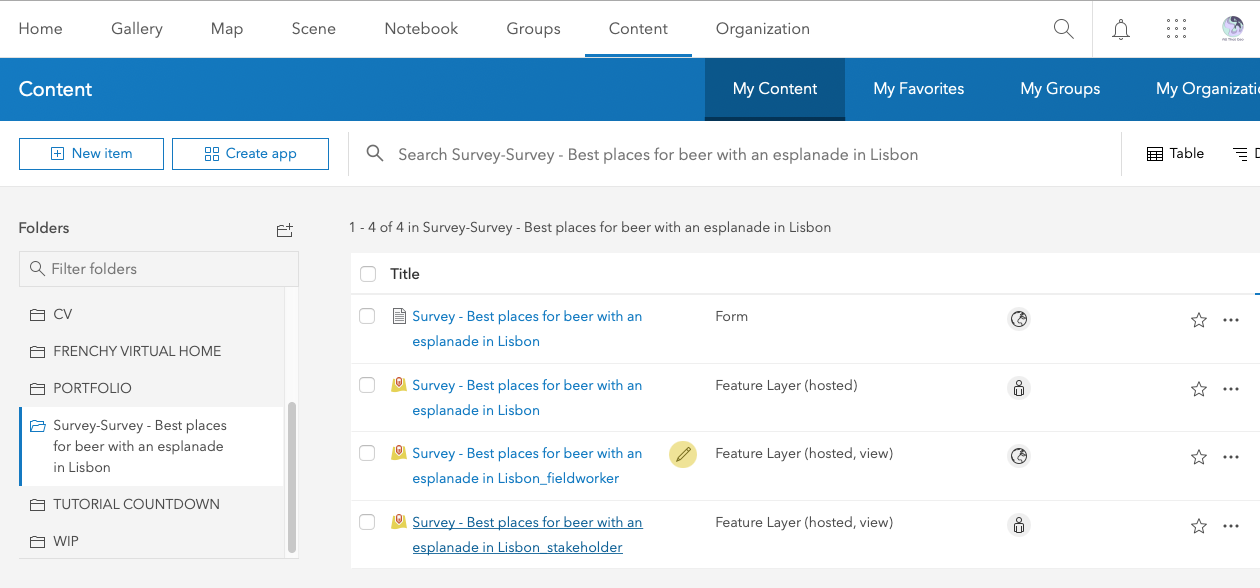
Go to your ArcGIS Online home and click on Content.

You'll notice that a folder starting with Survey has been automatically created on the left. Inside this folder, you'll find some items:
- the survey Form that you've just created in Survey123
- the Feature Layer (hosted) that stores the survey submissions
- two Feature Layer (hosted, view)
We will update the Best places for a beer with an esplanade in Lisbon_stakeholder view to exclude the ‘N’ from showing in the map tour we’ll create later. To do so, start by clicking on the name.
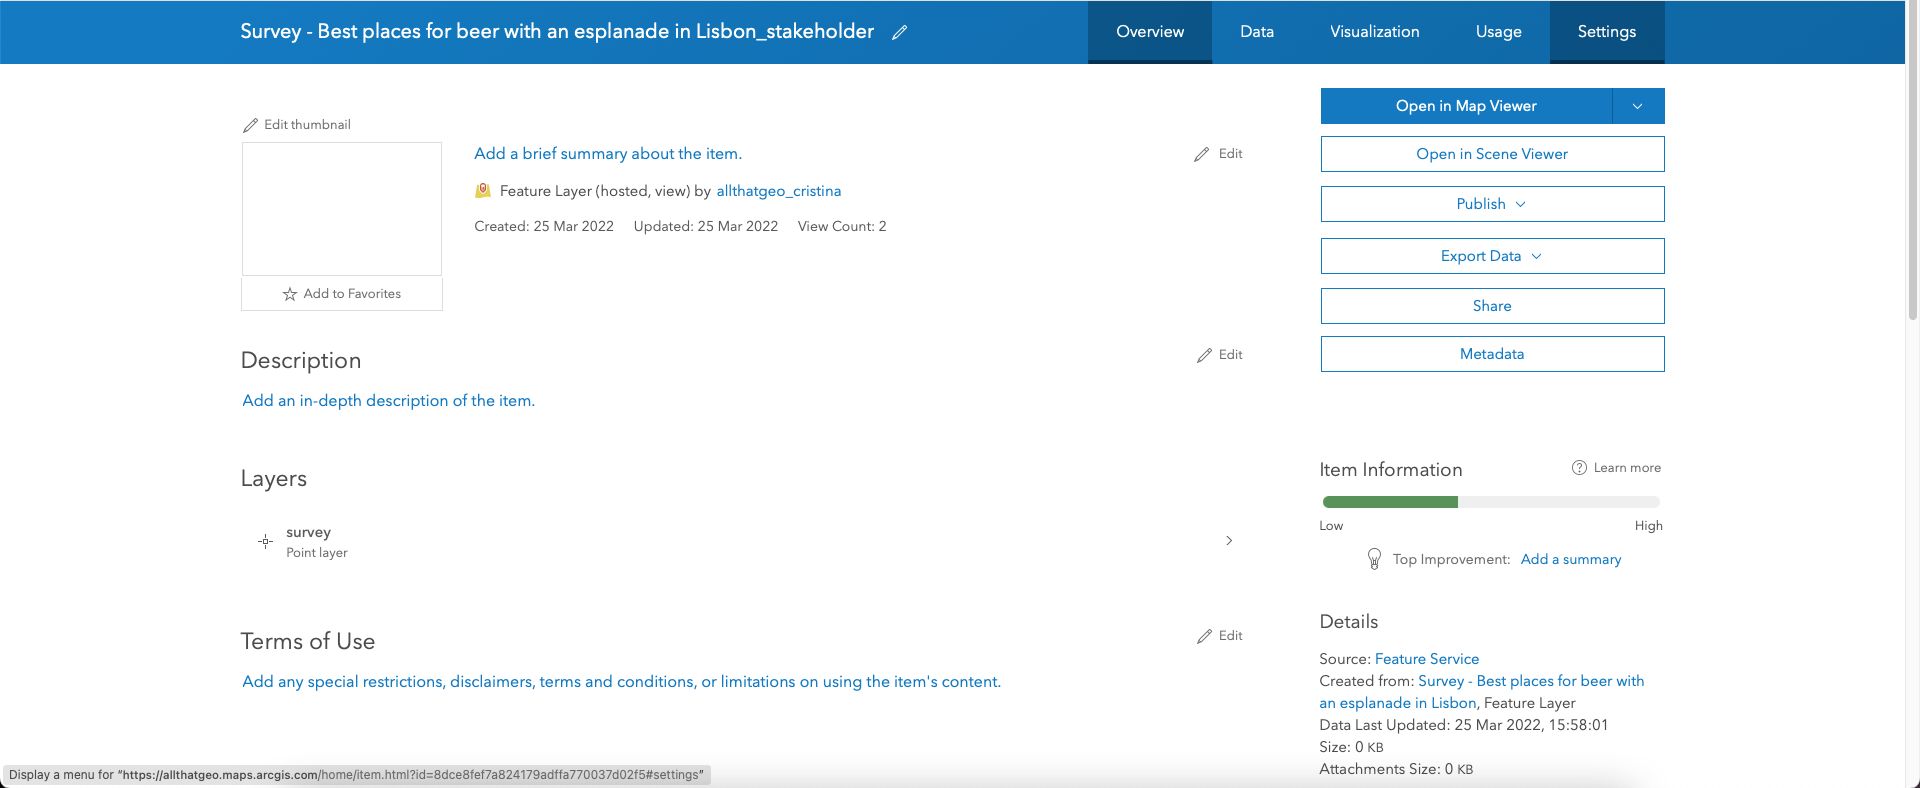
Now choose Settings.
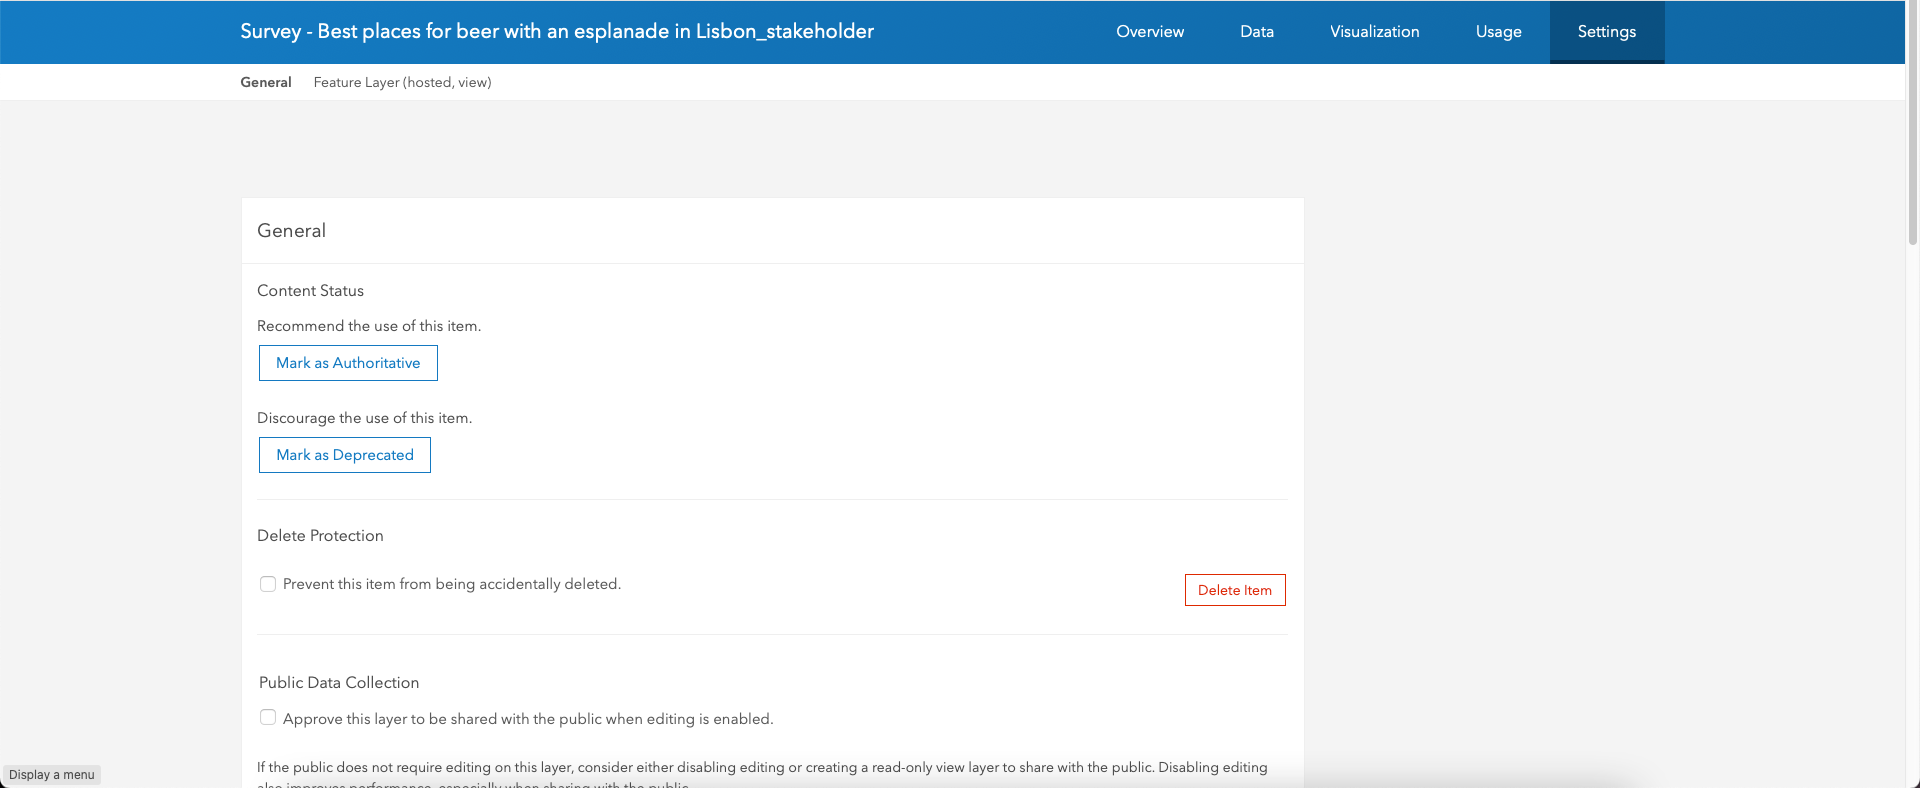
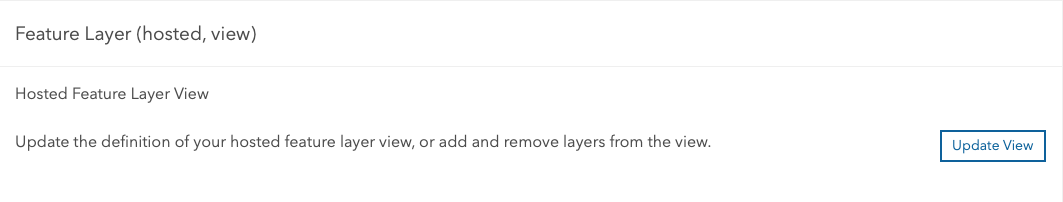
Further down, you'll find the Update View button. Click on it.
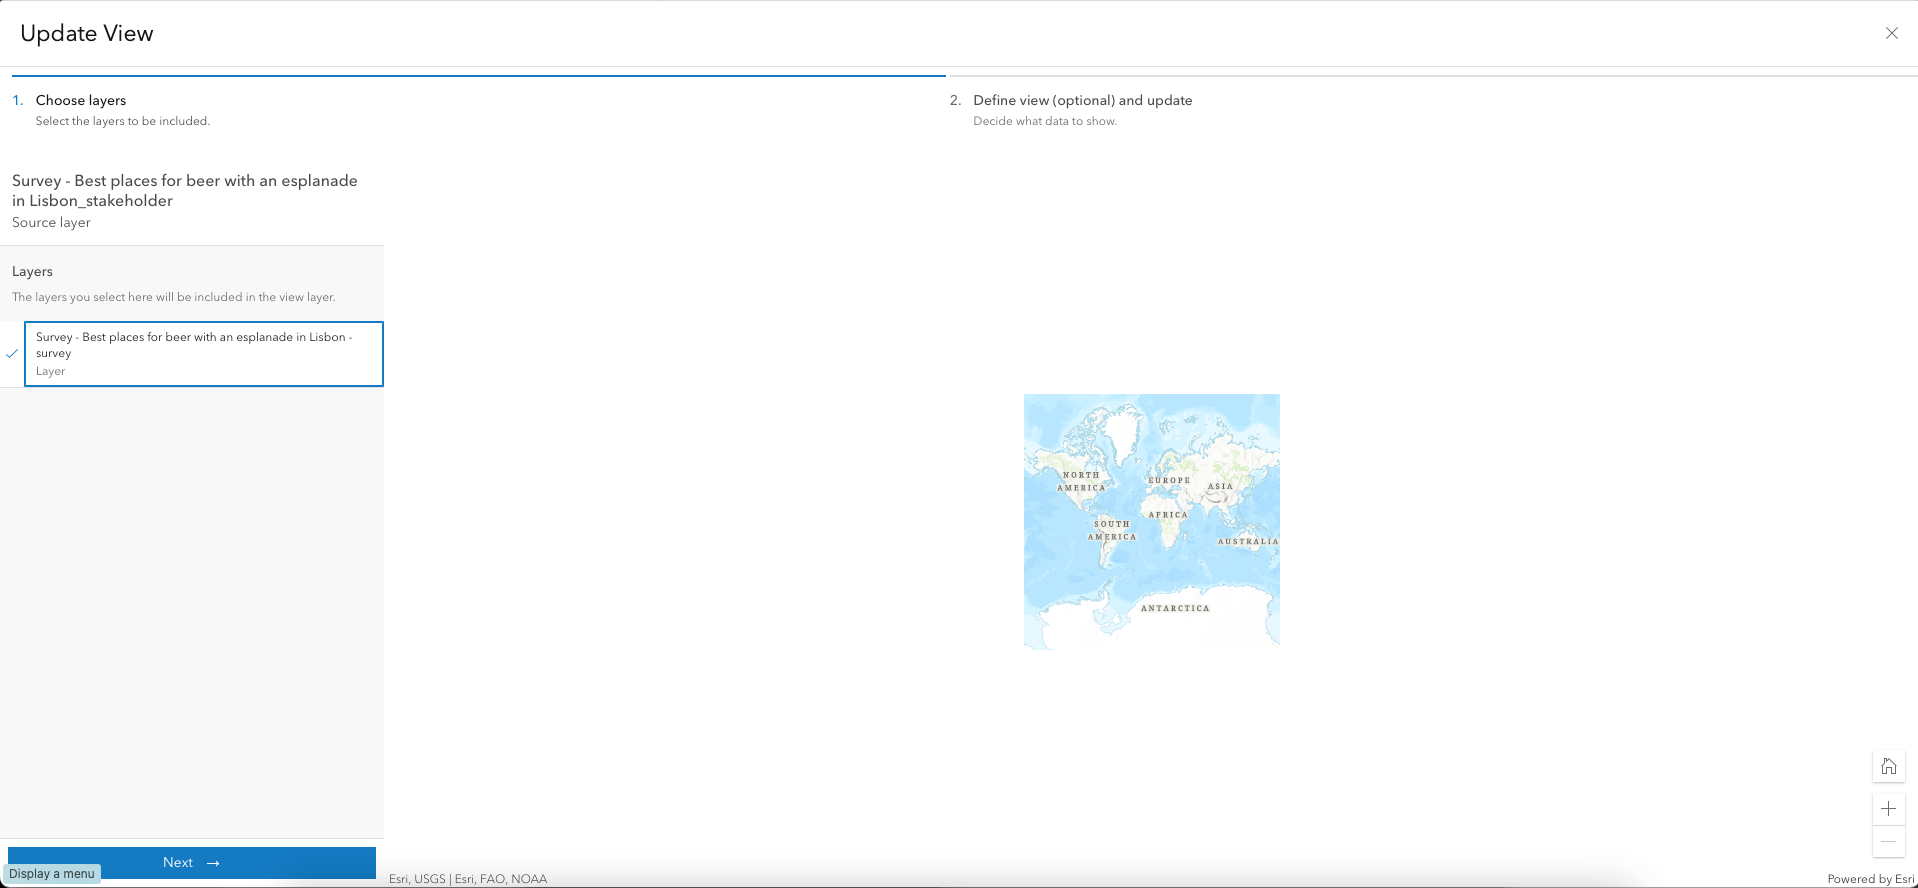
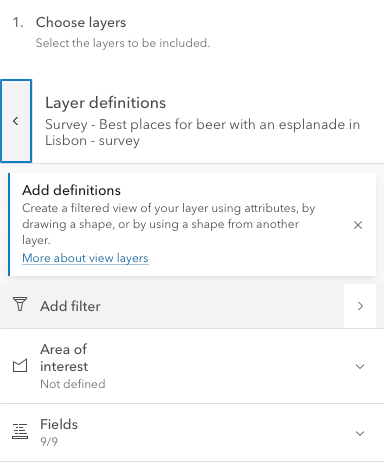
Select the layer on the left and hit Next.
Select the layer again.
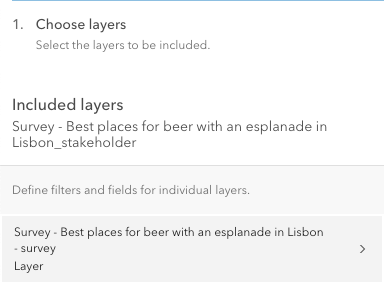
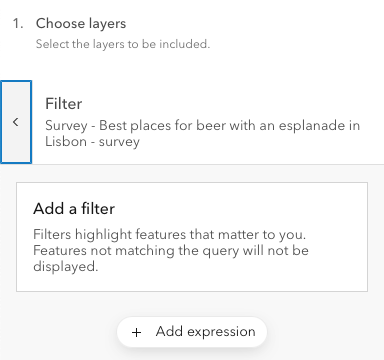
Click on Add filter.
Then, click on Add expression.
This is where you set up the filter. Compose the expression like so (not forgetting to select the N value):
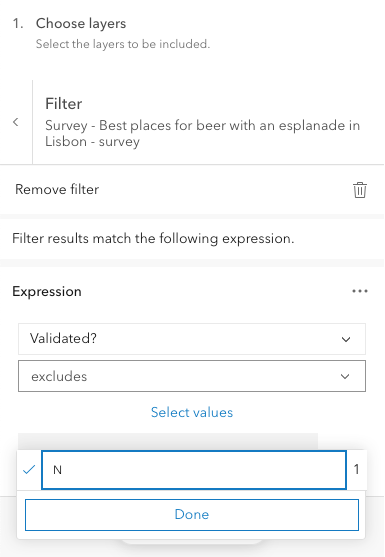
Hit Done.
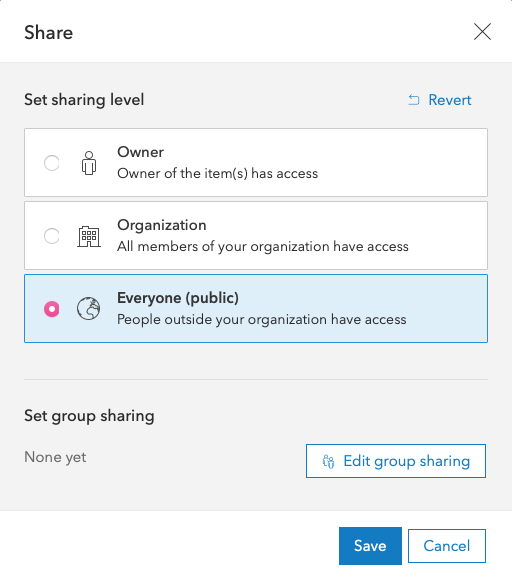
Now go back twice and hit Update. Wait until the page closes. When you're back to the view's Settings page, switch to the Overview tab and click on the Share button on the right.
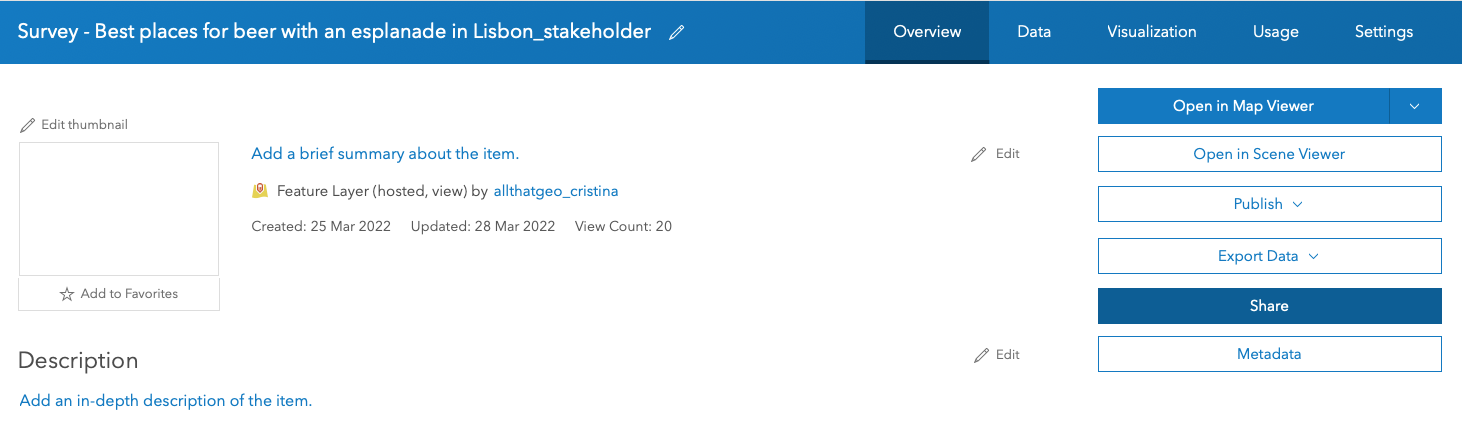
You'll need to share the view publicly so that everyone sees the submitted survey entries in the map tour you'll create shortly. To do so, choose Everyone (public) and hit Save.
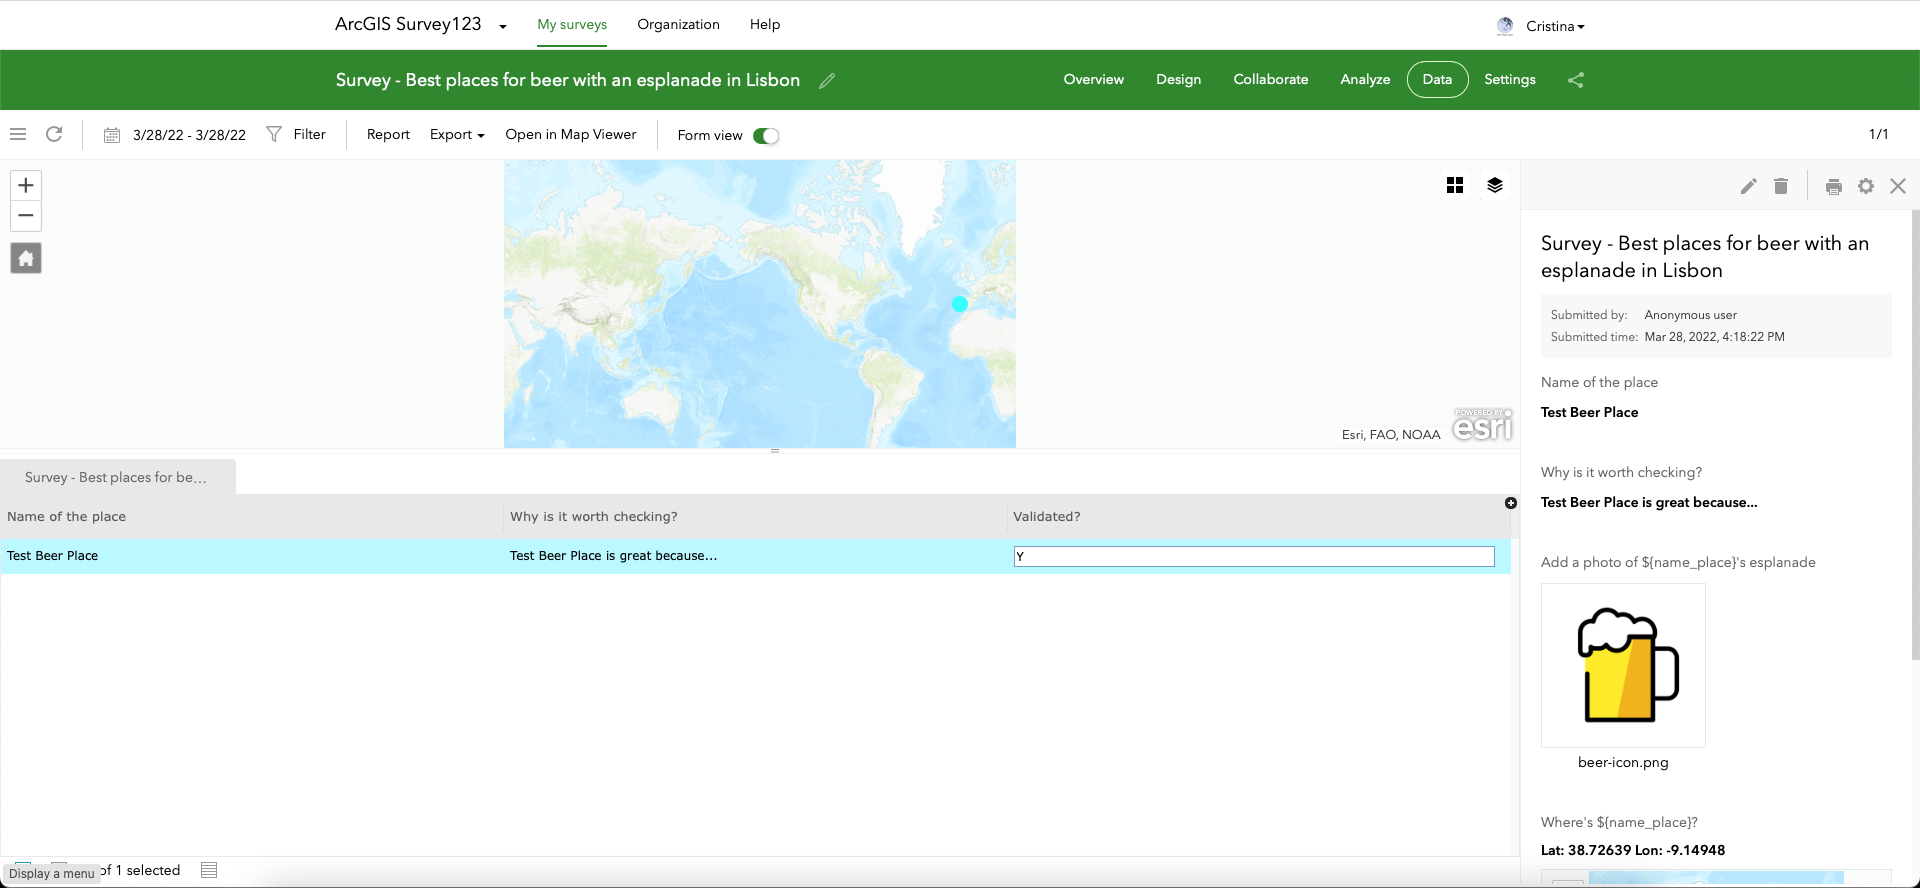
Now, do you remember the dummy entry you submitted earlier? When you submitted it, it got the answer 'N' (default value). Unless you change it, your submission will not show on the map tour later, as we've set up a filter in the view excluding it.
Go back to your survey, choose Data, double-click the value in Validated and change it to 'Y'. Each time you have new submissions, you will need to repeat this validation process.
3 Create a visualisation
Choose → Prepare → Create → Share
ArcGIS StoryMaps is an excellent tool for sharing location-driven stories enriched with multimedia. That is precisely what we're after here: sharing a crowdsourced list of favourite places (breweries), along with a description, photo and location, in a map tour format. In addition, we'll embed the survey to make it easier for someone interested in that curated list to contribute.
3.1 Build a story map
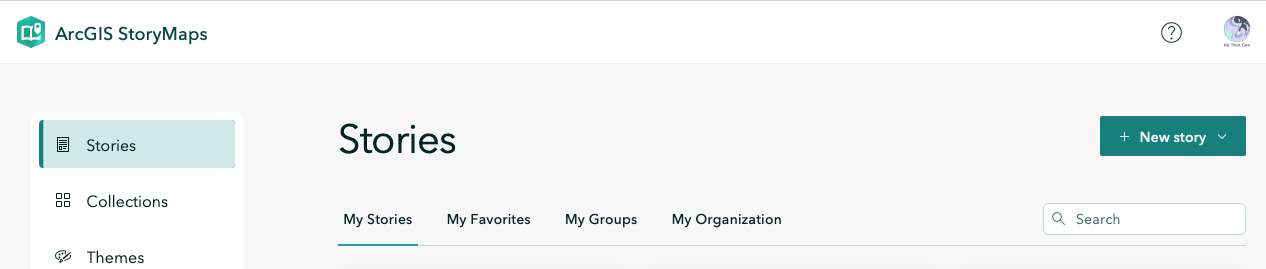
Go to the App Launcher on your ArcGIS Online home and choose StoryMaps.

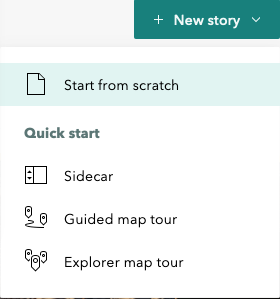
Click on + New story.
Select Start from scratch.
You are now taken to the story map editor.
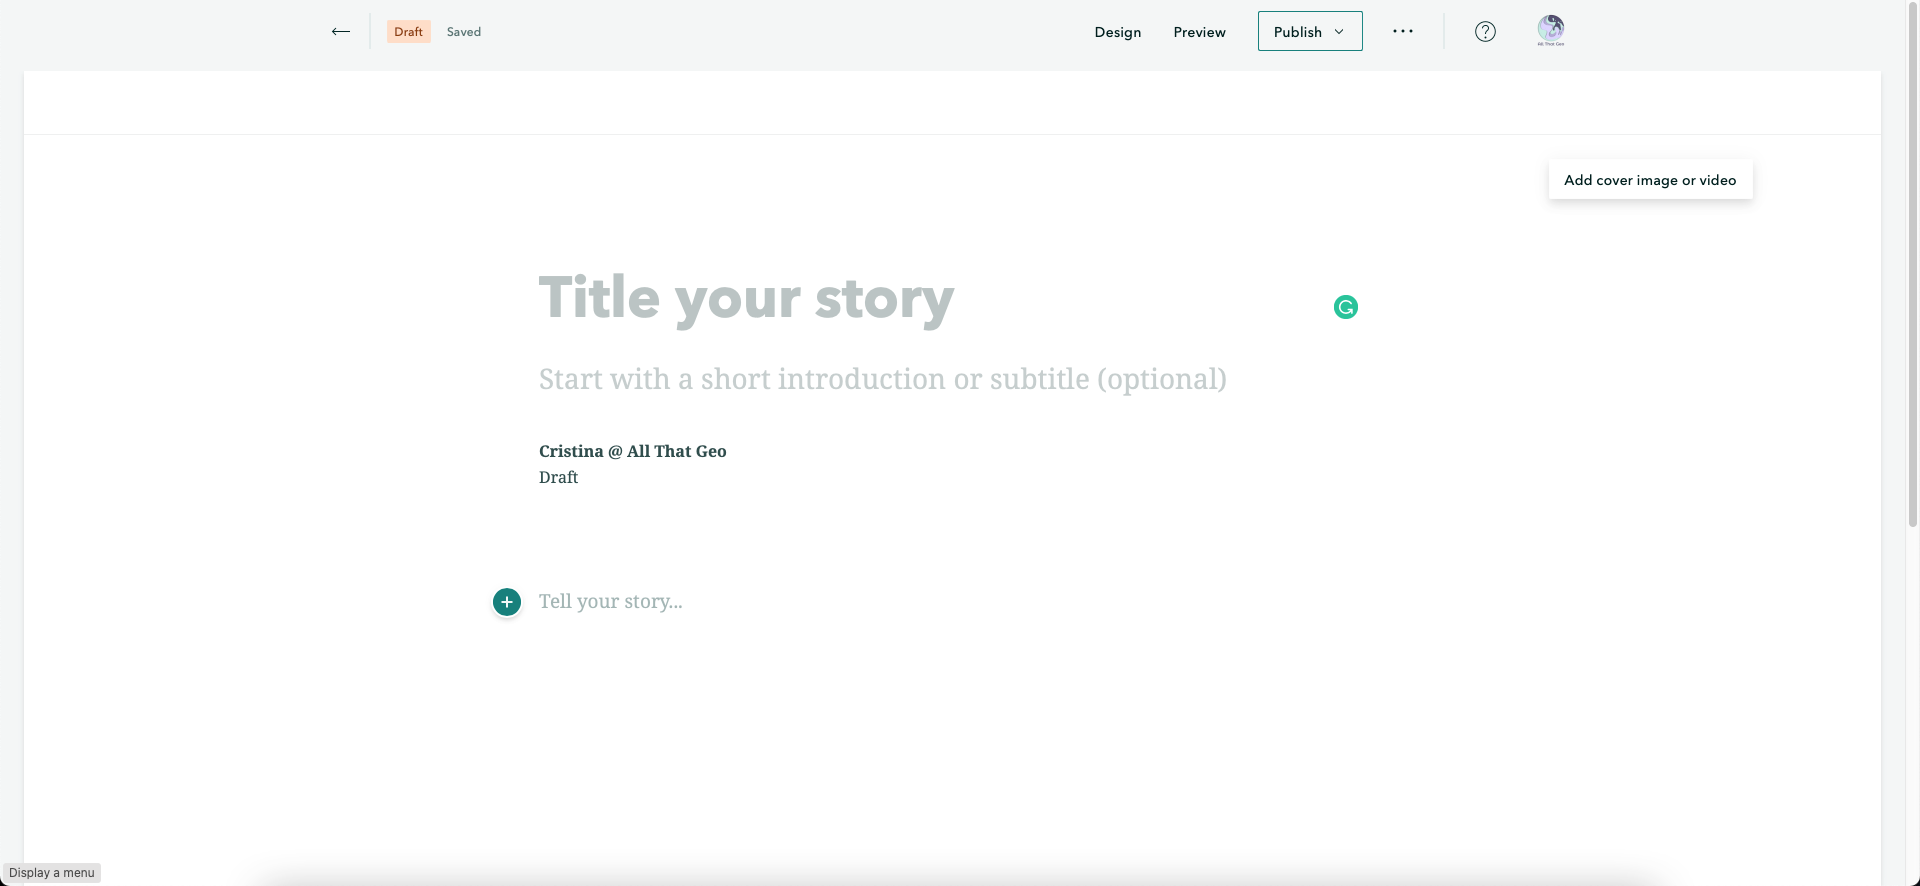
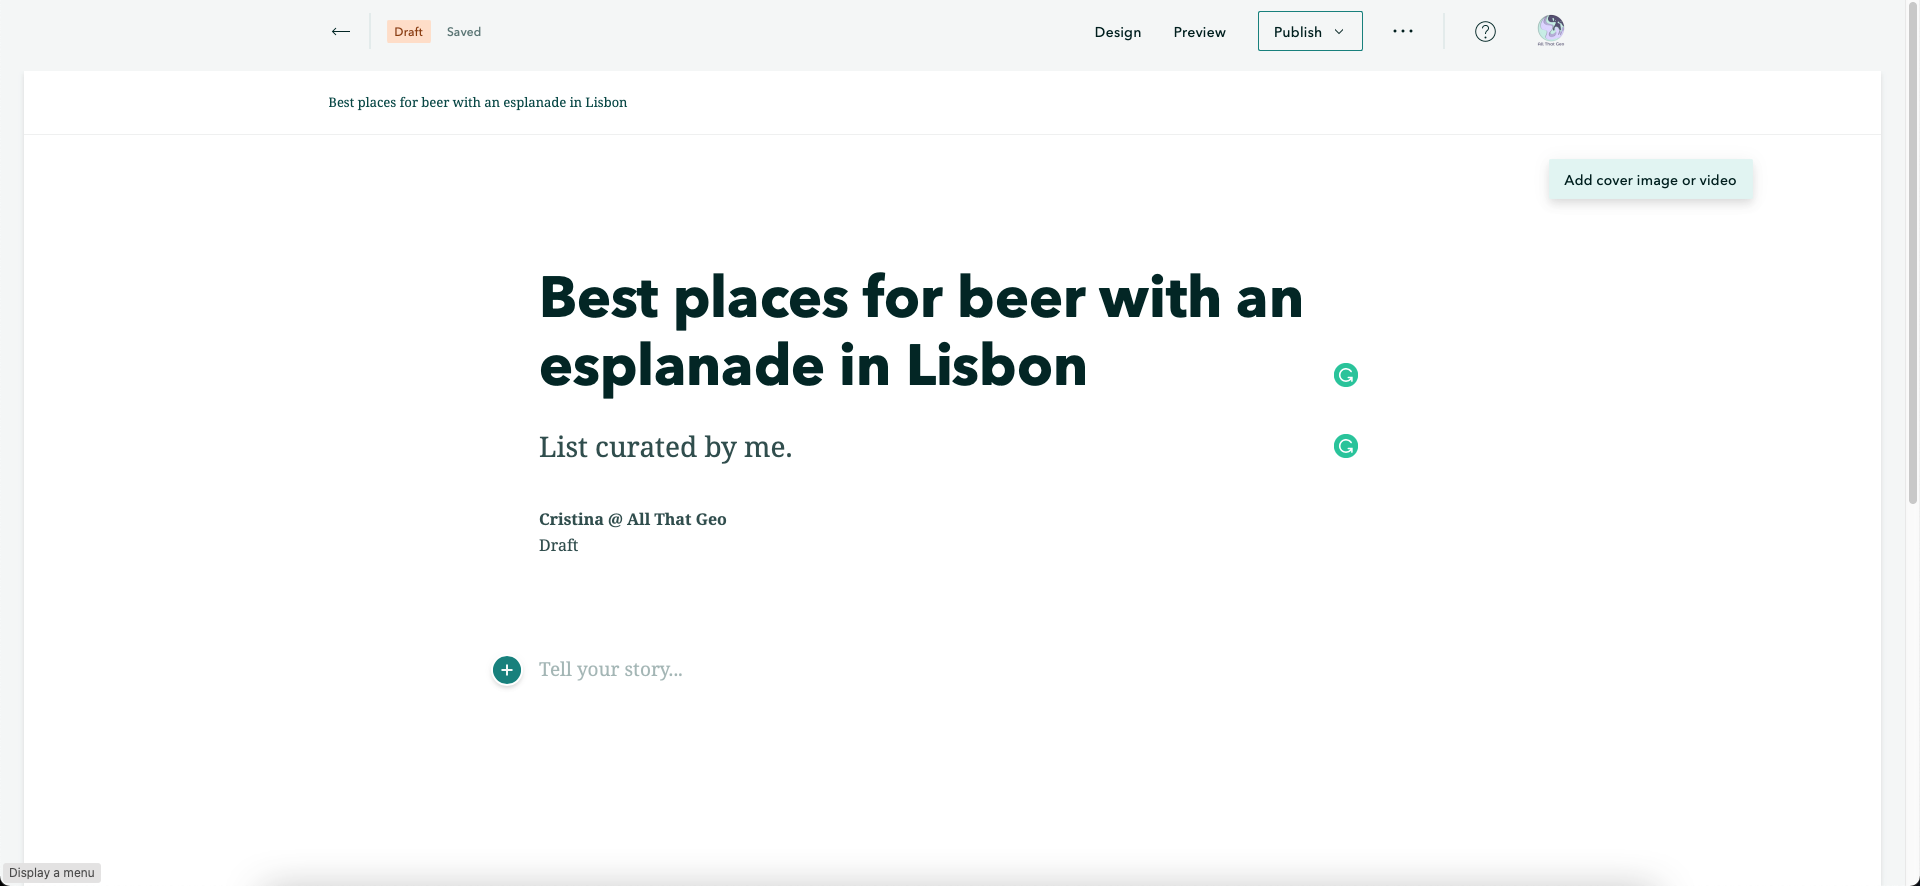
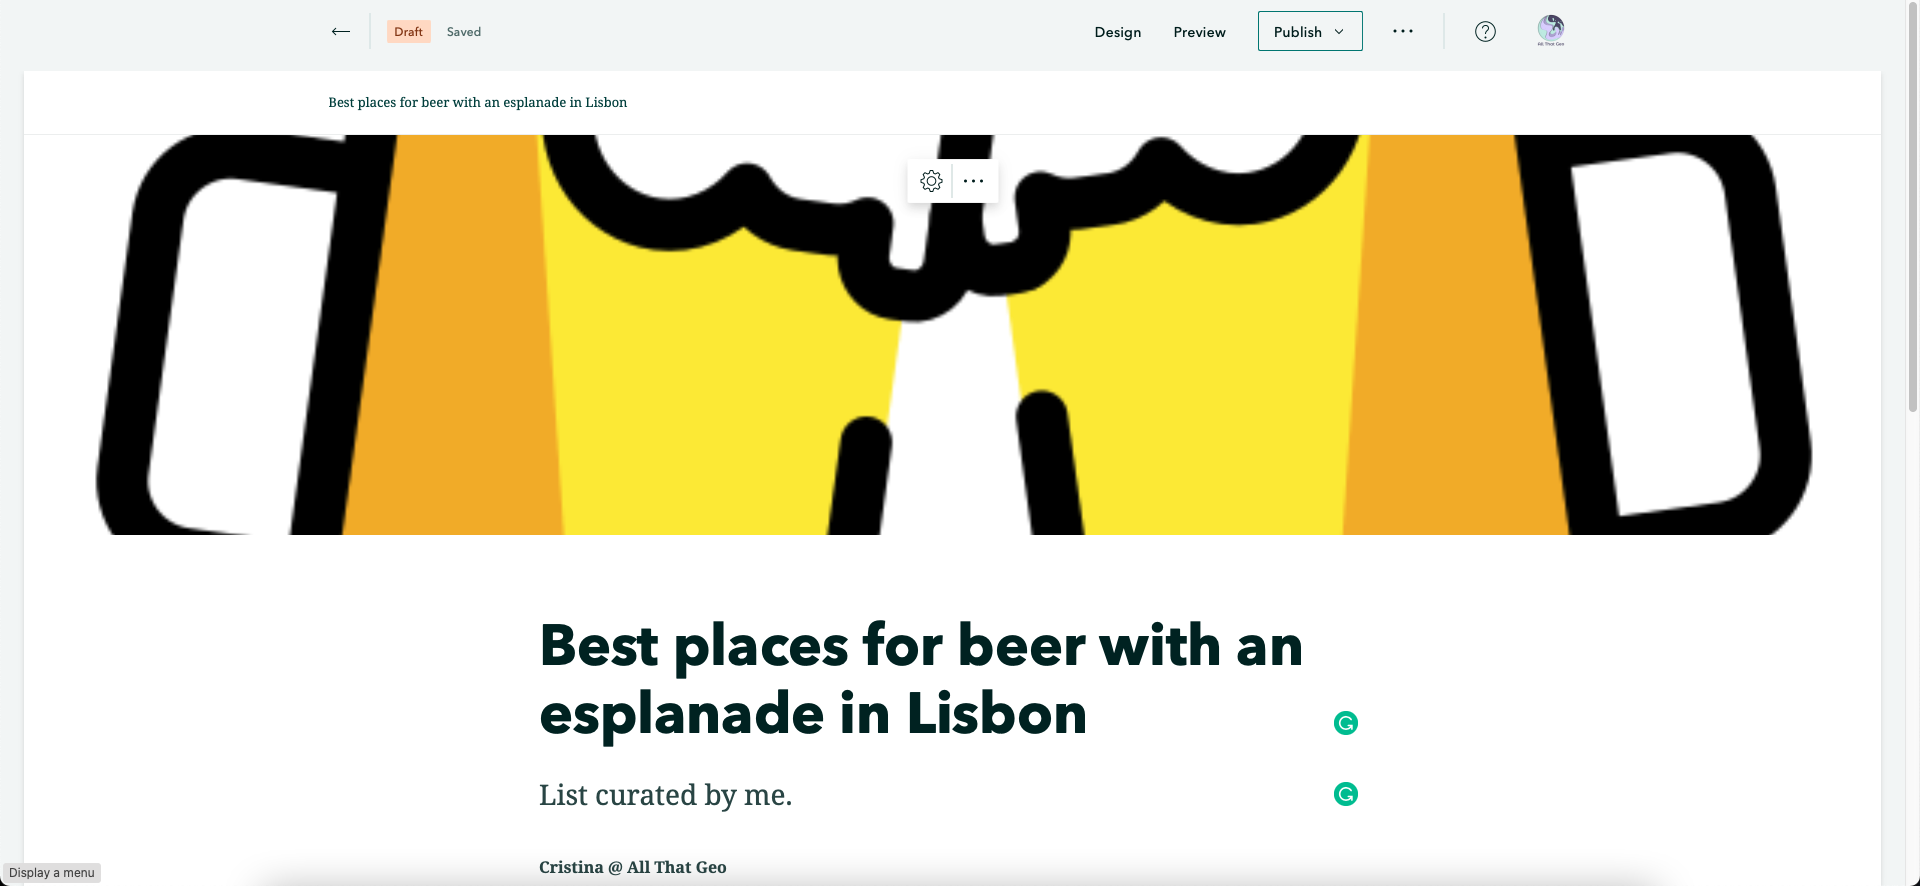
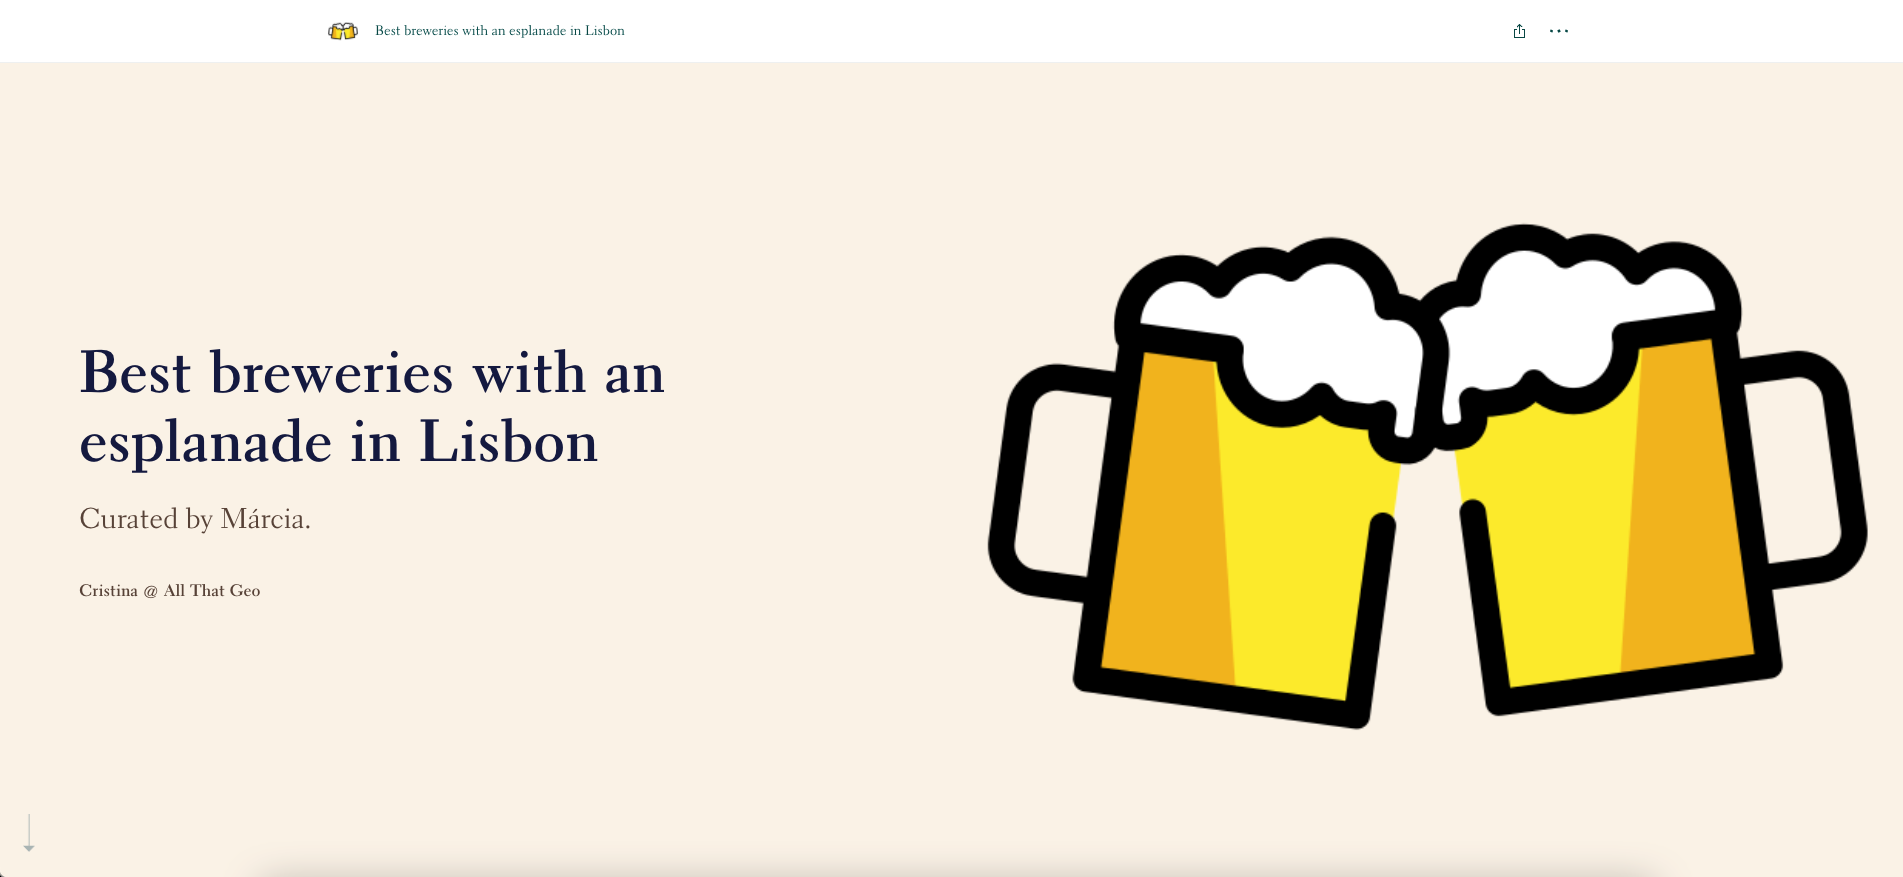
Set a Title and a short introduction or subtitle of your choosing. Then, click on Add cover image or video (on the right-hand side).
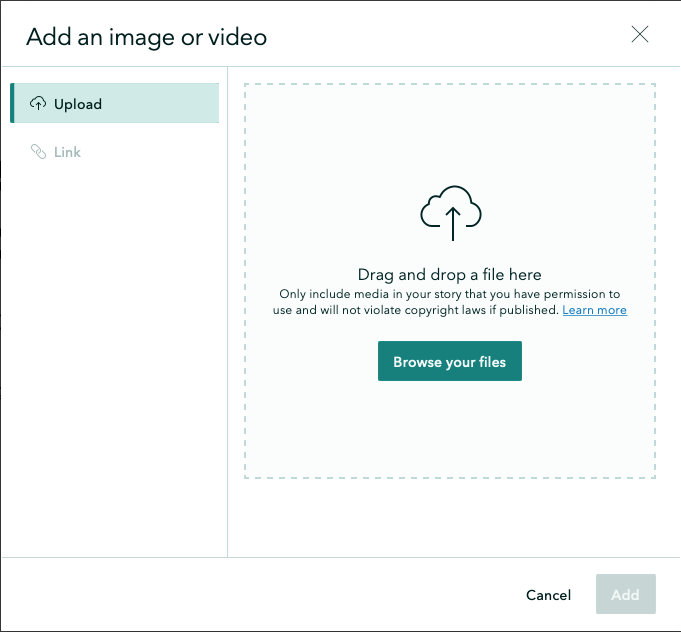
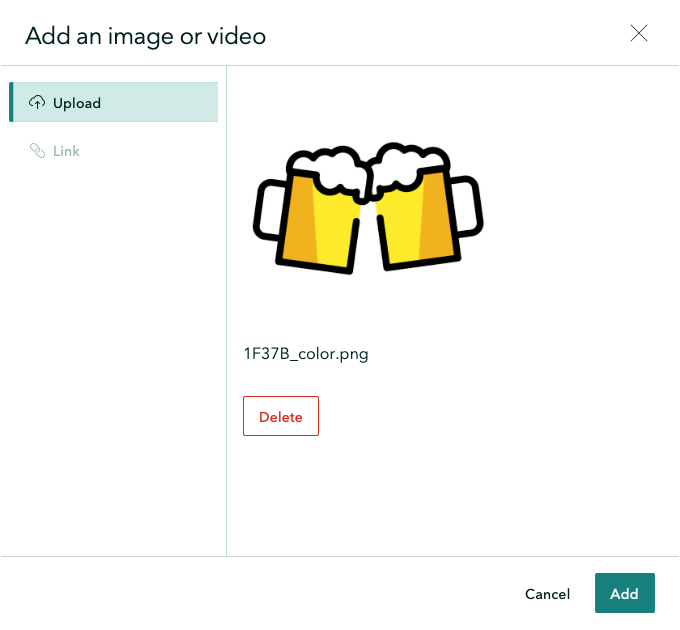
Browse your files and find the beer emoji you used earlier.
Hit Add.
Let's leave it as is for now. You'll have the opportunity to customise the cover of your story map later.
3.2 Add a map tour to the story map
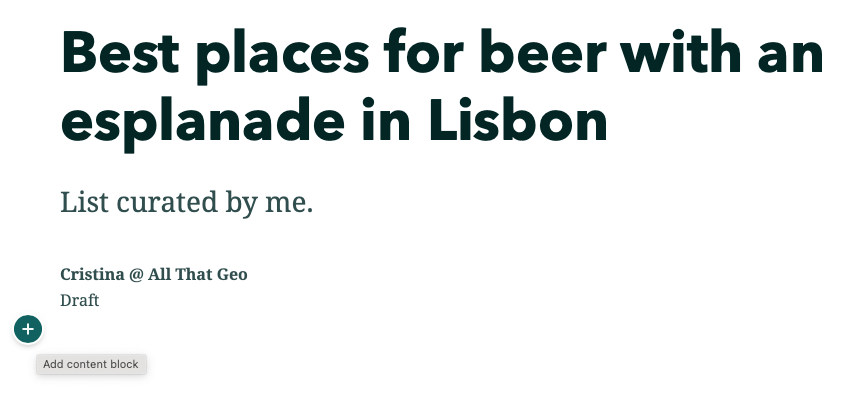
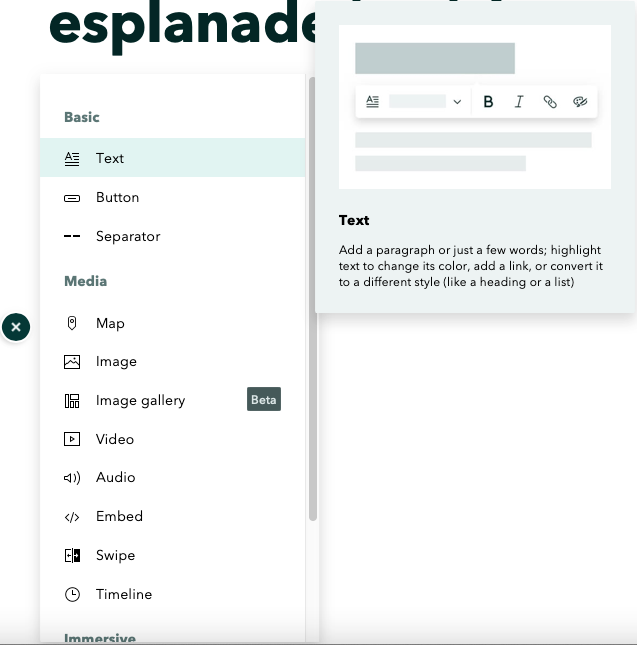
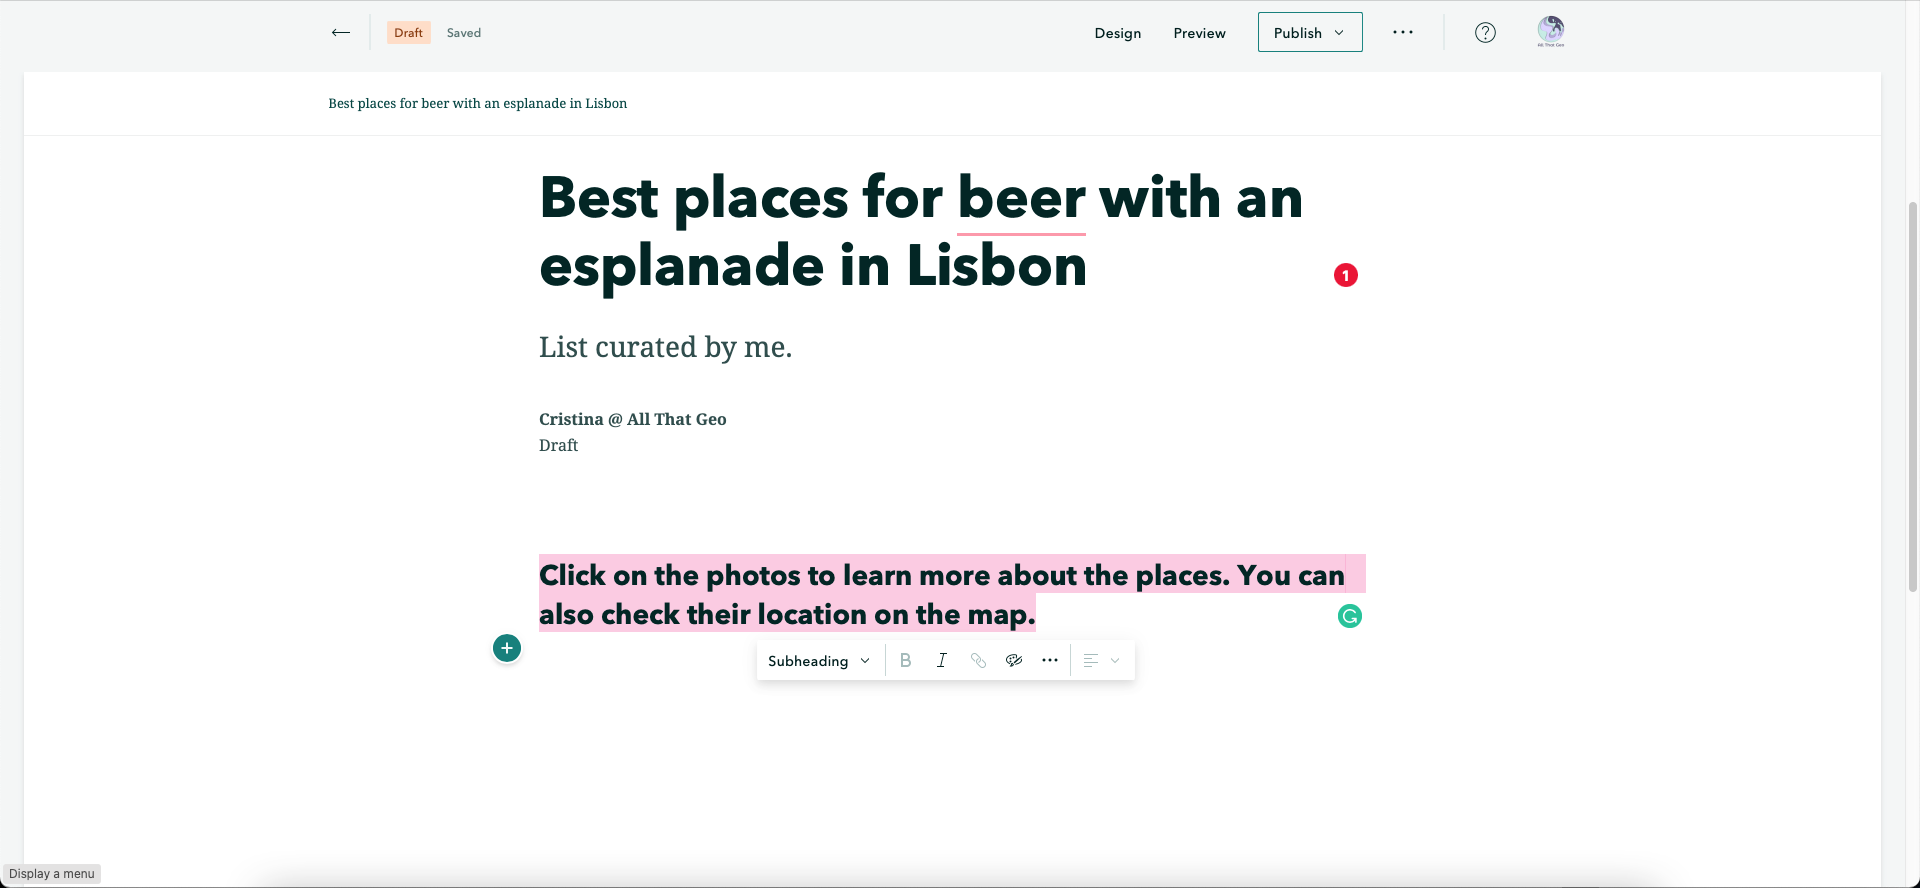
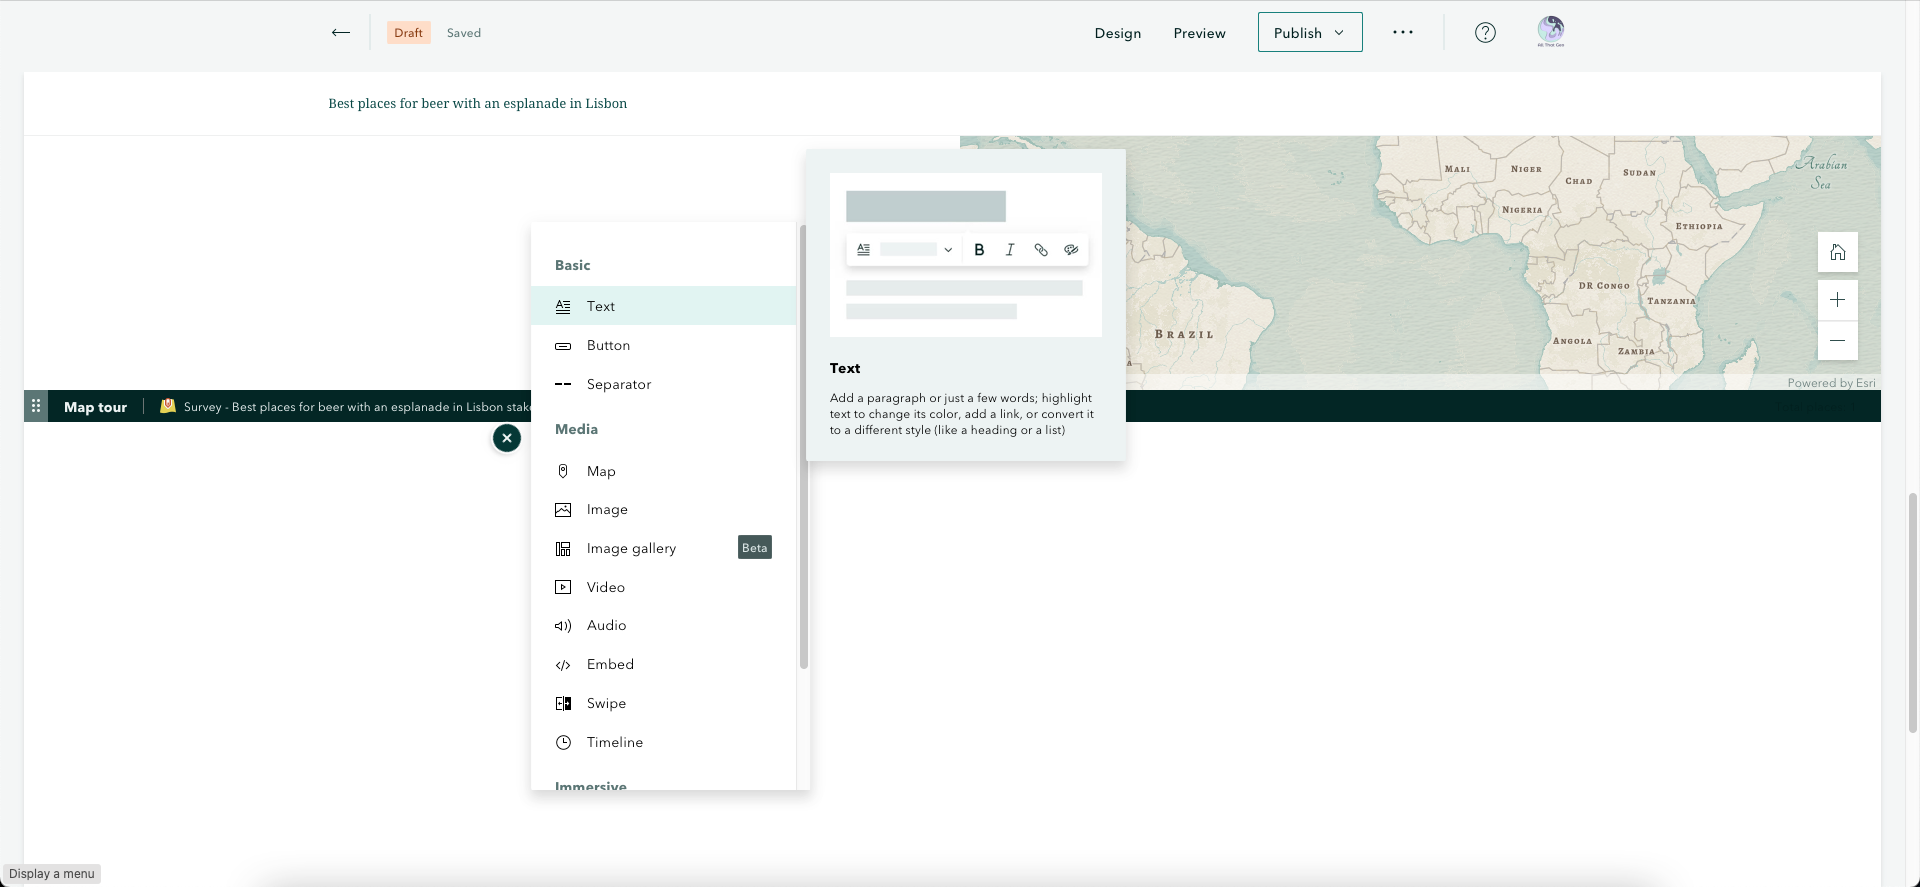
We'll now give the viewer a few instructions on interacting with the map tour. First, click on the '+' sign, Add content block, on the left...
... and select Text.
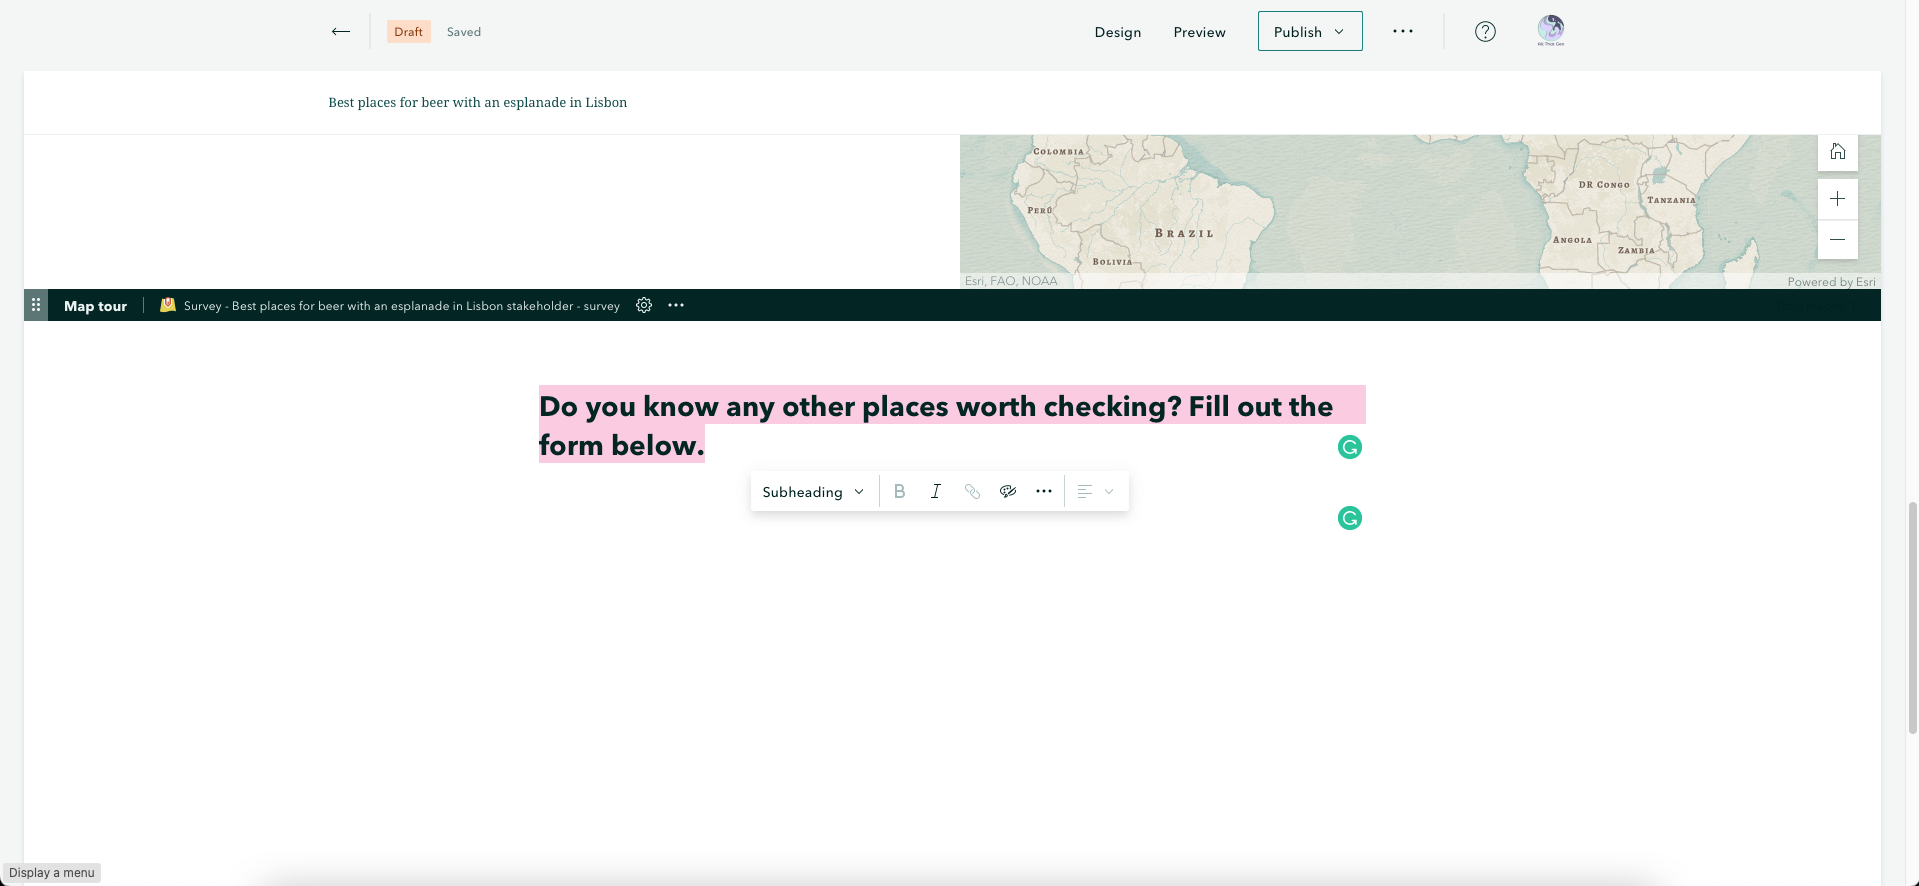
Choose Subheading...
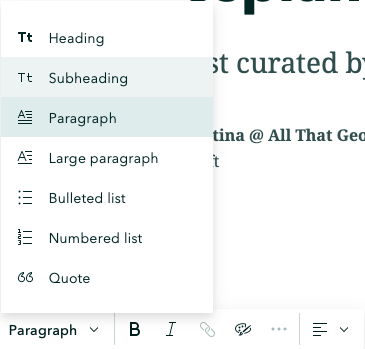
... and enter the following text:
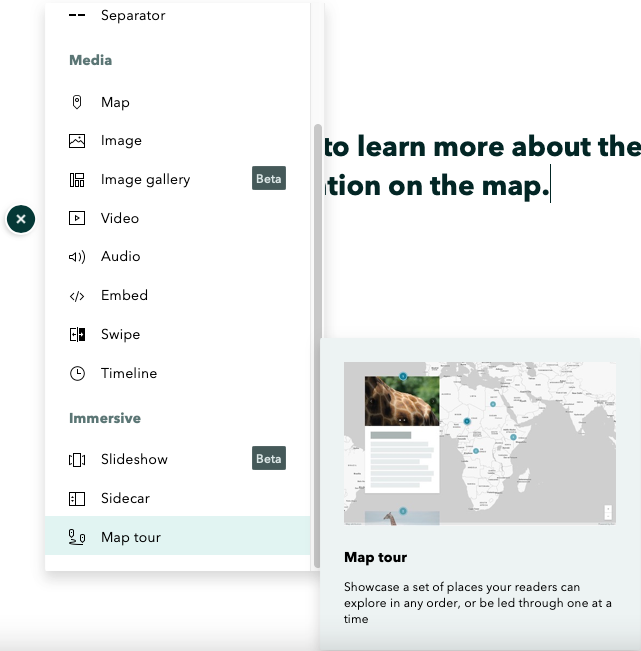
Click on the '+' sign again and choose Map tour.
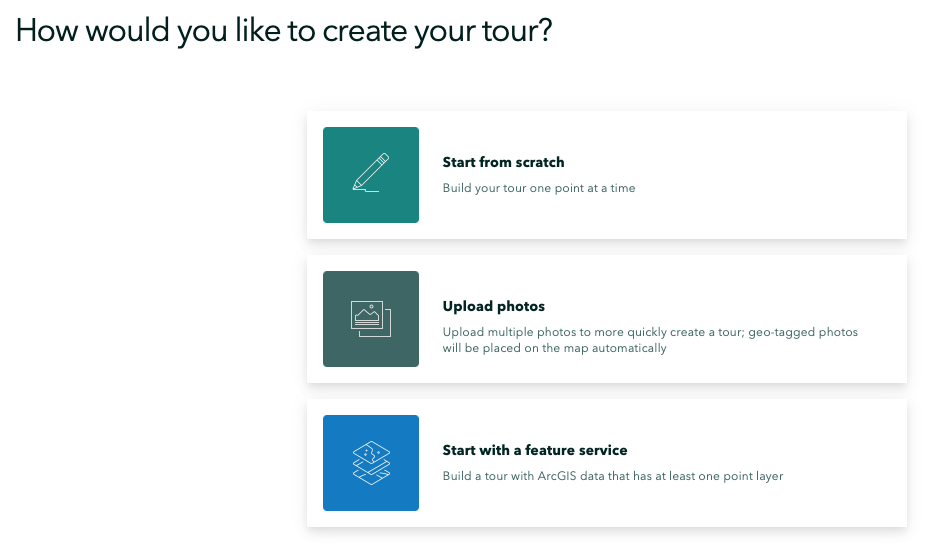
When asked How would you like to create your tour, choose to Start with a feature service.
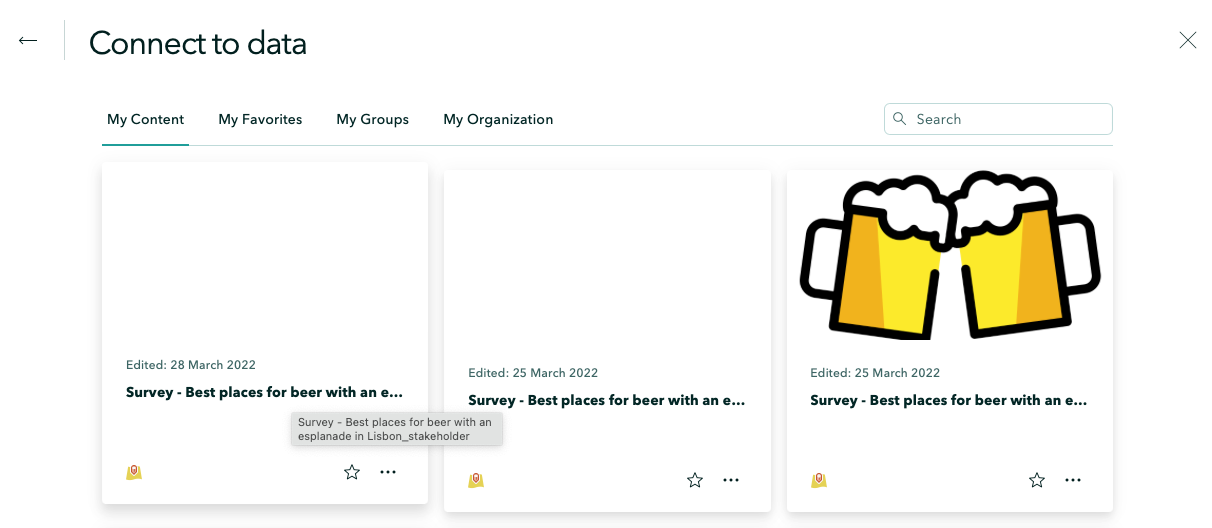
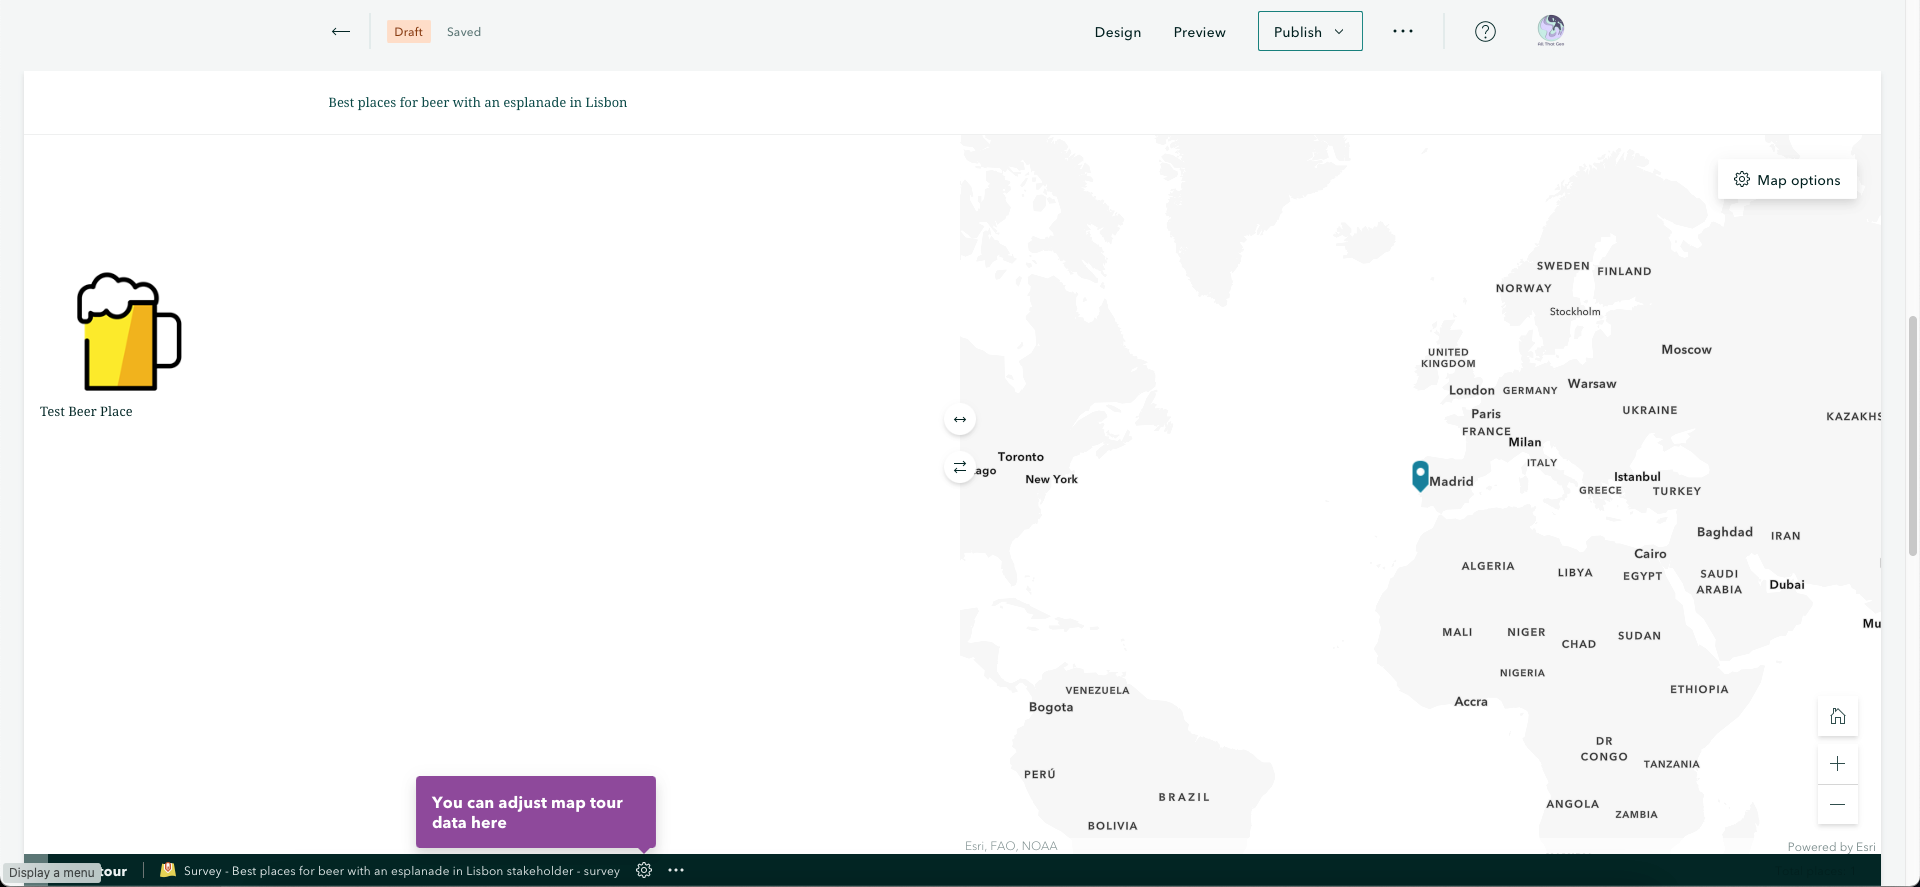
Choose the Survey - Best places for a beer with an esplanade in Lisbon_stakeholder item.
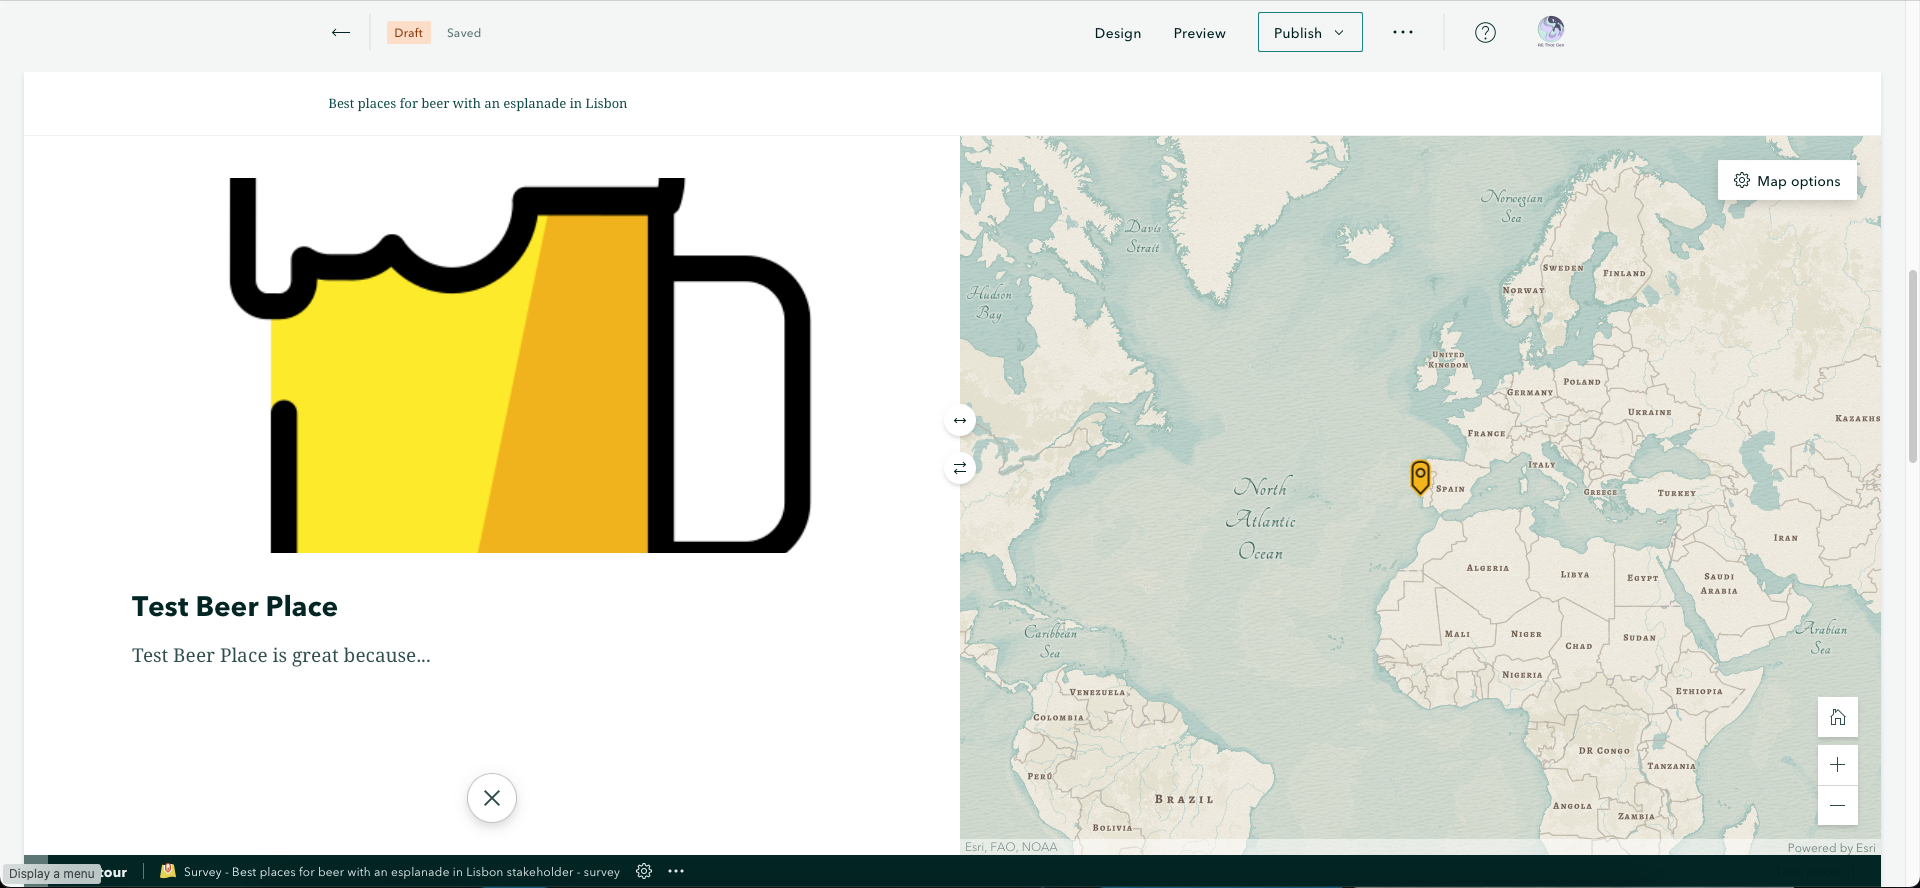
Notice how your dummy submission is already showing! Let's now follow the suggestion in the purple pop-up at the bottom: You can adjust map tour data here.
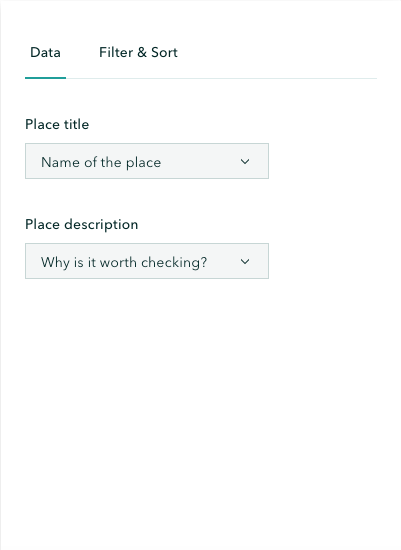
Make sure Place title and Place description are pointing to the correct fields (i.e. questions) from the data (i.e. survey).
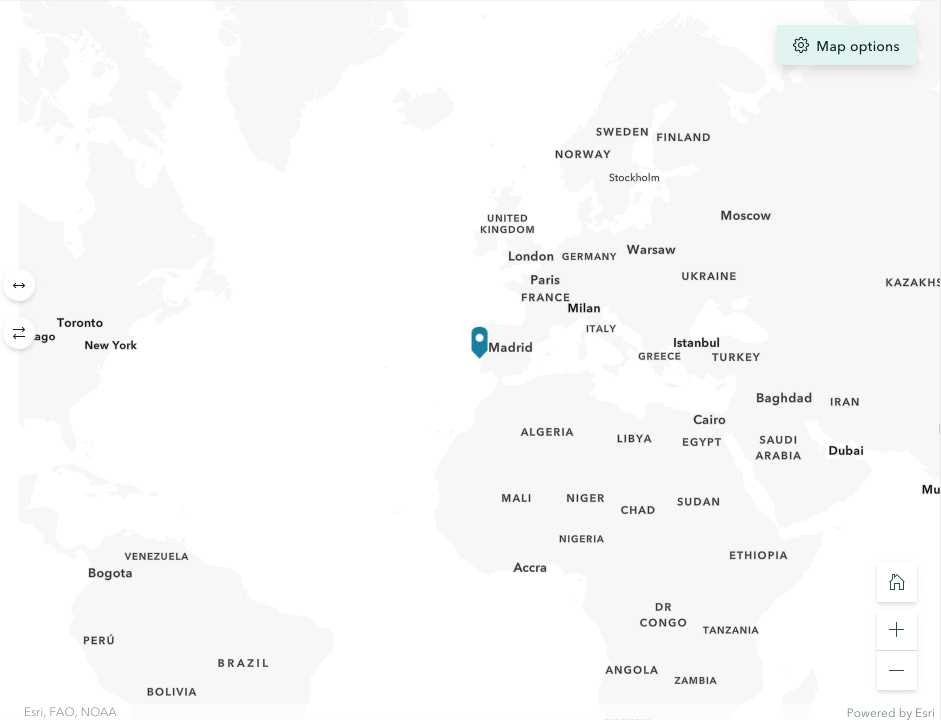
Click on Map options (on the upper right of the map).
In Select basemap, choose Modern Antique and, in Point color, change it to the yellow HEX code, 'f3b41c' (from the image colour picker website).
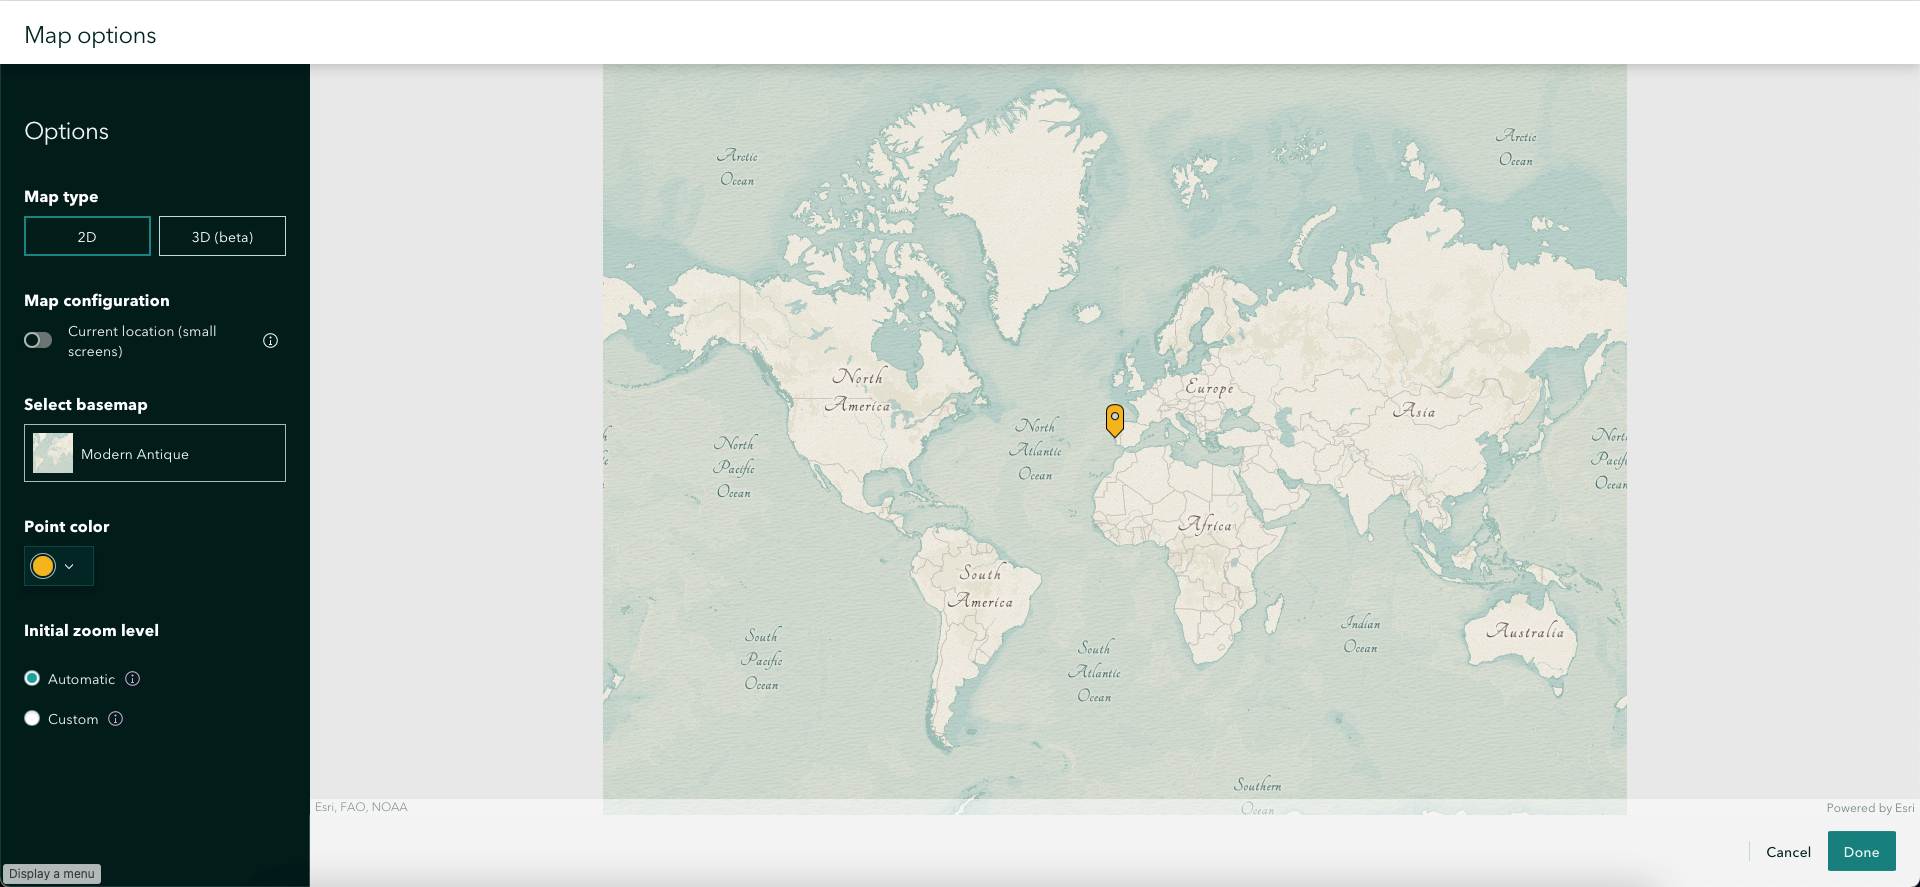
Hit Done.
Now perform a quick test and click on the image to see what happens!
3.3 Embed the survey in the story map
We're now going to embed the survey to make it easier for those interested in the curated list of breweries to contribute with suggestions.
To do so, click on the '+' sign and choose Text.
Enter a short introduction to the survey (in Subheading style).
Below, click on the '+' sign again and choose Embed.
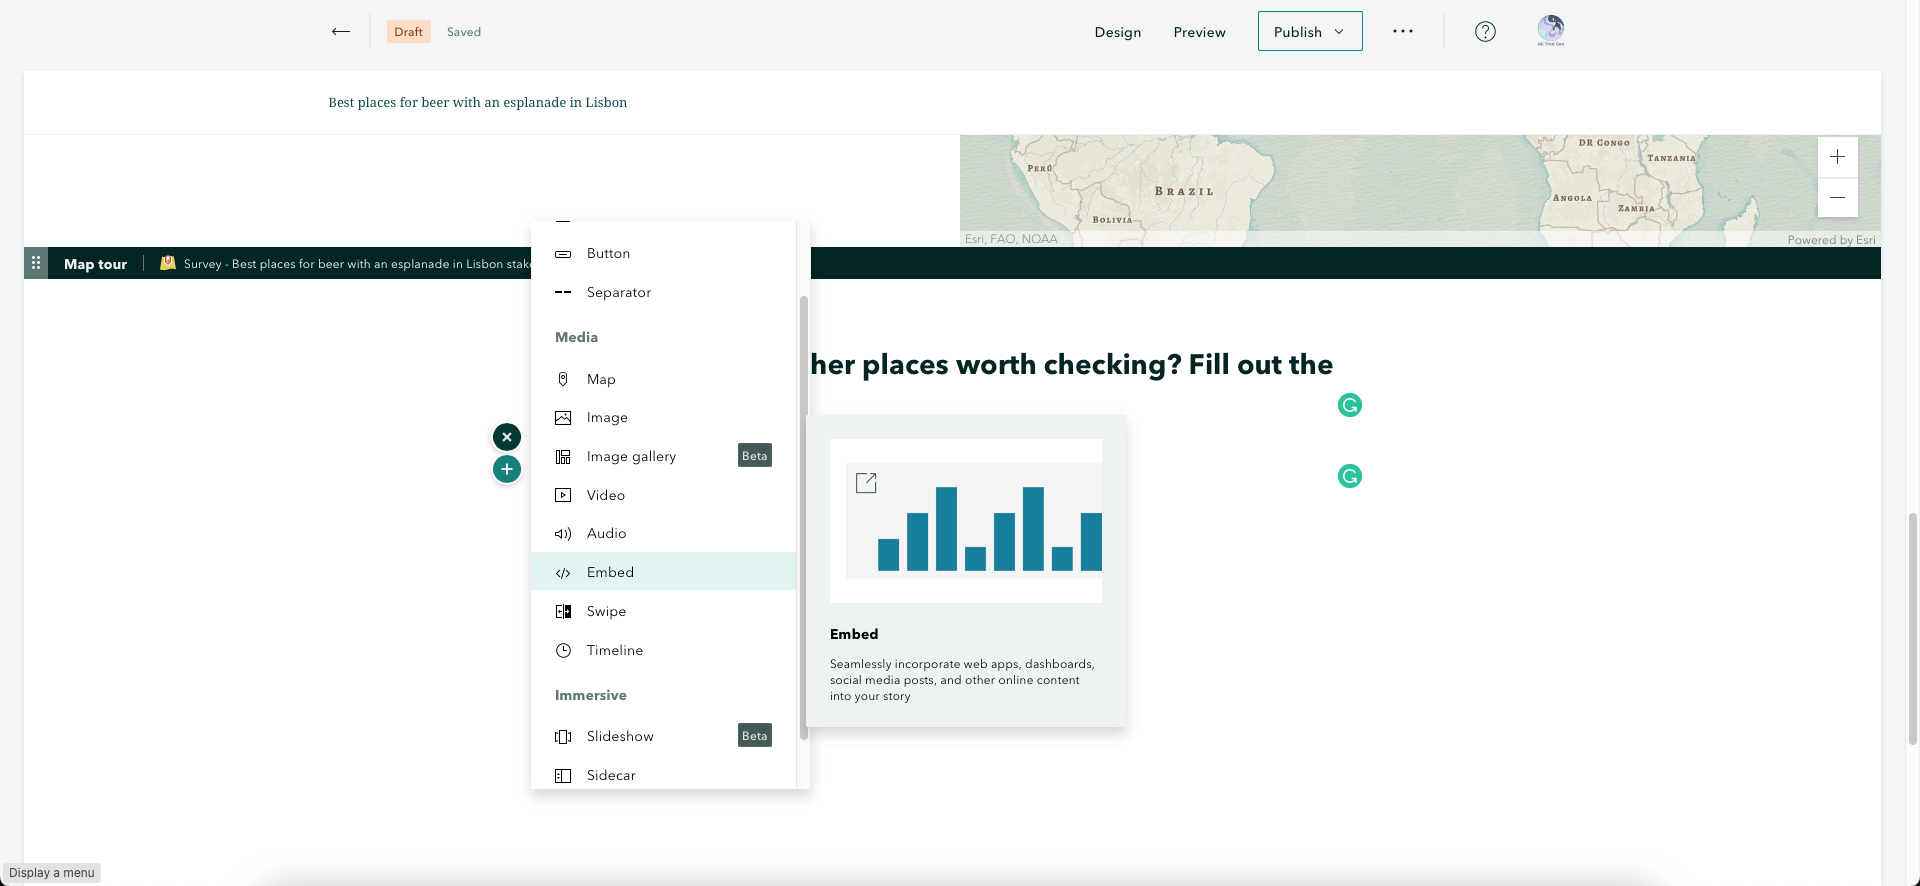
Paste the survey URL from earlier.
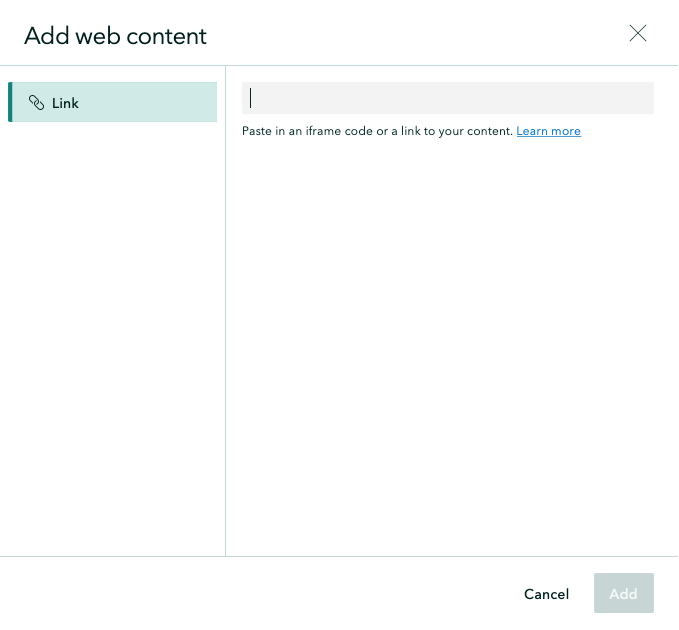
Hit Add.
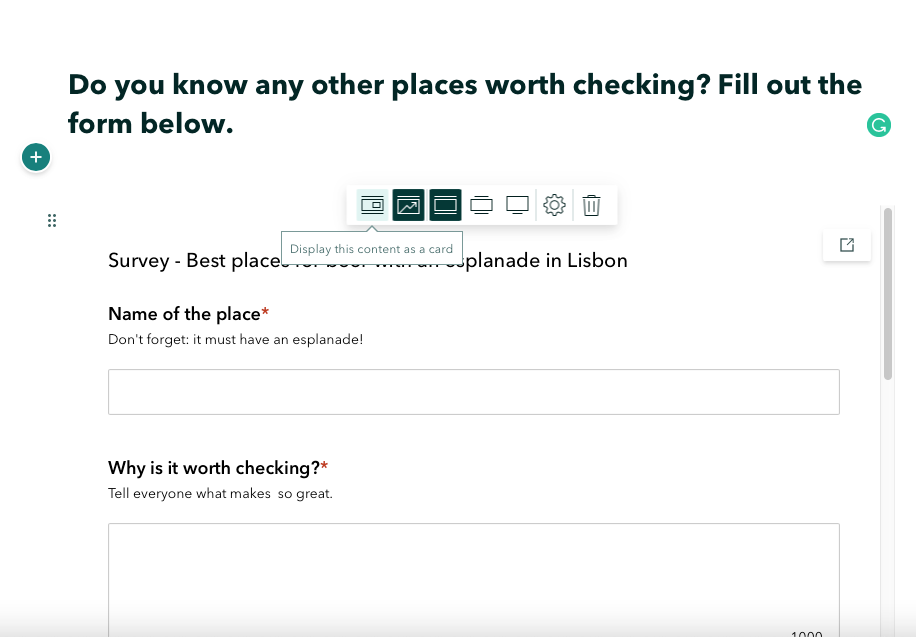
Instead of showing the form directly on the story, we'll opt for a clickable card. To do so, choose to Display this content as a card.
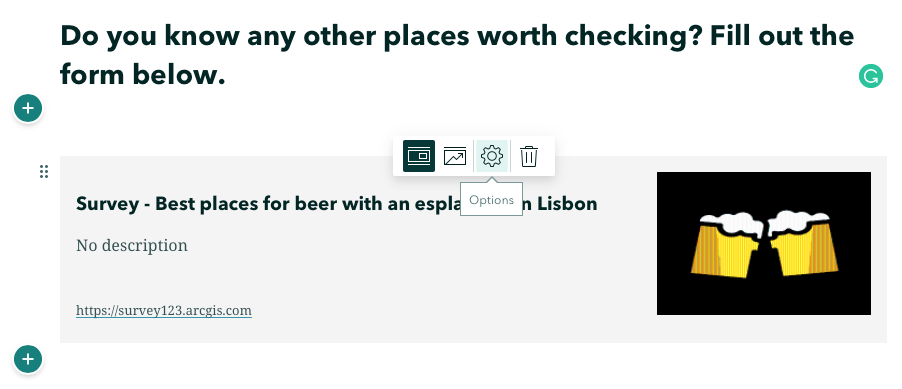
Now click on Options to customise the card.
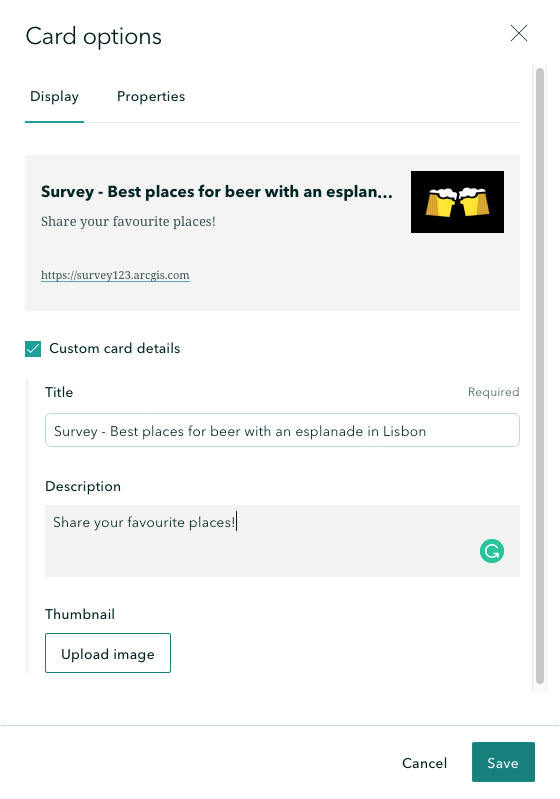
Enter a Description and hit Save.
3.4 Add a credits section and change the story map’s design
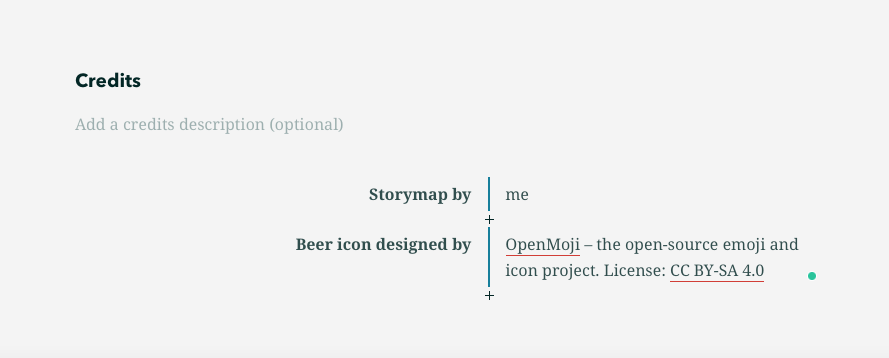
Now scroll down and add the story map Credits (as desired).
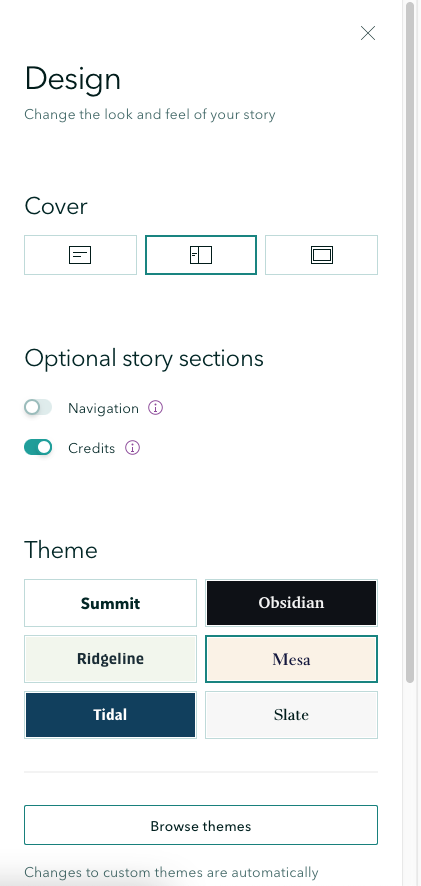
At the top of the story map, select Design. Change the Cover layout to Side-by-side and the Theme to Mesa. Close the pane.

4 Share your work
Choose → Prepare → Create → Share
4.1 Publish your story map
It is now time to publish your story map and share it with your friends!
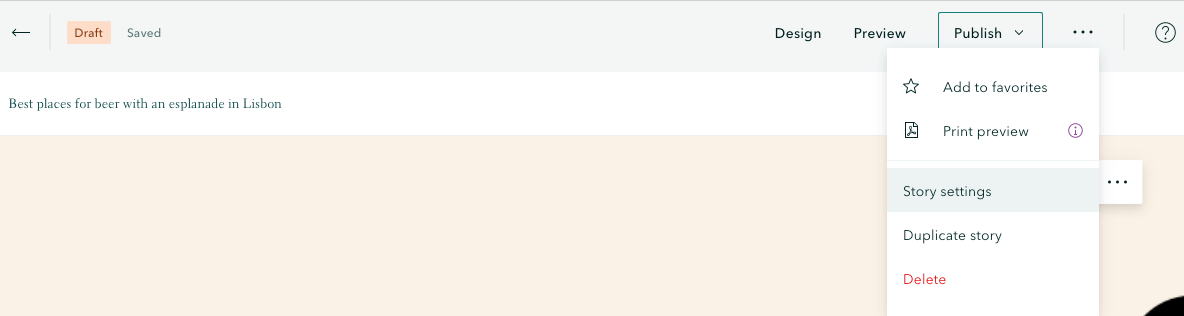
Before you publish, though, there are still a few steps to perform. First, click on the ellipsis icon next to Publish button and choose Story Settings.
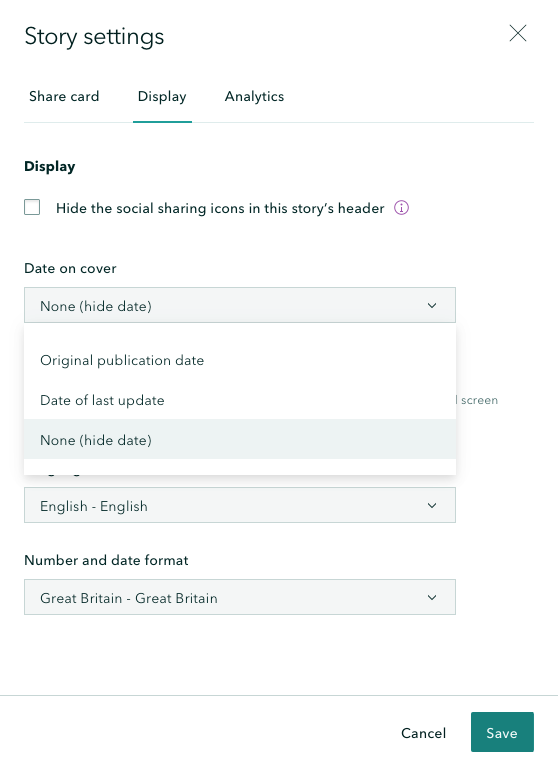
Feel free to explore all settings, but for now, we'll only change the Date on cover to None (hide date). Hit Save.
Now, validate if all looks good by clicking on Preview (you can even test it in different screen sizes, just to be sure!).

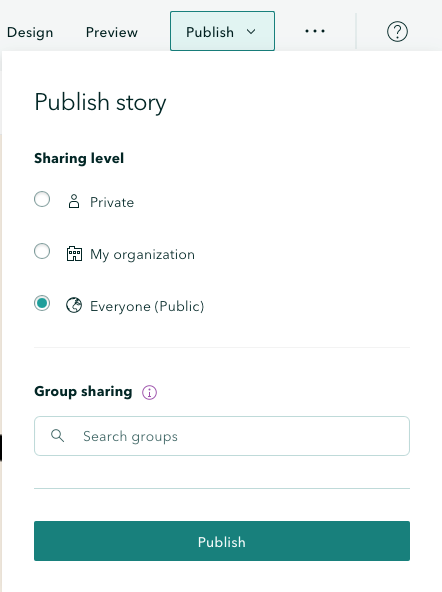
Once you make sure it is good to go, click on Publish and change the Sharing level to Everyone (Public). Hit Publish.
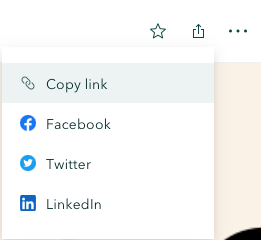
The story map is now published! Click on the share icon and choose Copy link.
Open your story map URL in incognito mode. There's your web app - now share away!
Mine looks like this: https://tinyurl.com/cervejarias (text in Portuguese; use your browser translation tool if needed)👇
4.2 Make a tiny URL to customise your story map even further
Remember the initial idea behind all this? We wanted to crowdsource data from friends and share a curated list of favourite places (in this case, breweries). So sharing is, here, of crucial importance. When sharing the URL to your story map, no one will remember a URL with a series of characters and numbers that make no sense.
That's why you need a TinyURL. With a tiny URL, it will be easier to share the URL with your friends (even verbally!), reduce mistakes when typing and make your story map more personal.
🎉 Congratulations! You have just created a survey to crowdsource data, a map tour to display it, wrapped up in a story map!
In this tutorial, you have learnt to use ArcGIS Online to:
- Create a survey to crowdsource data
- Add a vetting field to your survey data model
- Submit a dummy entry to the survey
- Update a view to filter survey records
- Build a story map
- Add a map tour to the story map
- Embed the survey in the story map
- Add a credits section and change the story map's design
- Publish the story map
- Make a tiny URL to customise the story map even further

The Monthly with All That Geo
Want to learn how to use ArcGIS Online for spatial, data-driven storytelling? Sign up for The Monthly with All That Geo and I'll deliver a new example of an interactive web app straight to your inbox every month.
You'll get a behind-the-scenes look at how it was built—from the data collection process through the final app—so you can practice your own data visualisation skills and unlock your creativity as you go.
If you want to find inspiration to start a project that will make a difference in your study area or work, sign up for The Monthly with All That Geo!
Member discussion