The Monthly with All That Geo – June 2022

Welcome back to The Monthly with All That Geo by me, Cristina. Each month I bring you a new learning experience on geospatial data visualisation, analysis and storytelling.
In this issue:
🐾 How to create a 3-in-1 app to crowdsource data, analyse results, and share stories
A few months ago, I dedicated myself to a special pet project (pun intended): I wanted to share my dog Frenchy's life story with others.
But, you know, there are so many touching stories about greyhounds out there...
So, in addition to sharing Frenchy's story, I thought about a way I could collect other greyhound stories and showcase them. I wanted to create a web page where greyhound owners could add their dog's stories and meet other greyhounds.
All in one app, if possible!
And then I thought: how cool would it be if there were some analytics to detect trends amongst those dogs' behaviours?
Well, I admit, a bit too ambitious for just one app. But I wanted a one-stop app for greyhound stories so that people wouldn't have to access different apps, whether they were submitting stories or meeting other greyhounds. In other words, I wanted to maximise the user experience when visiting the web page.
The risk was that the app would look messy and unusable.
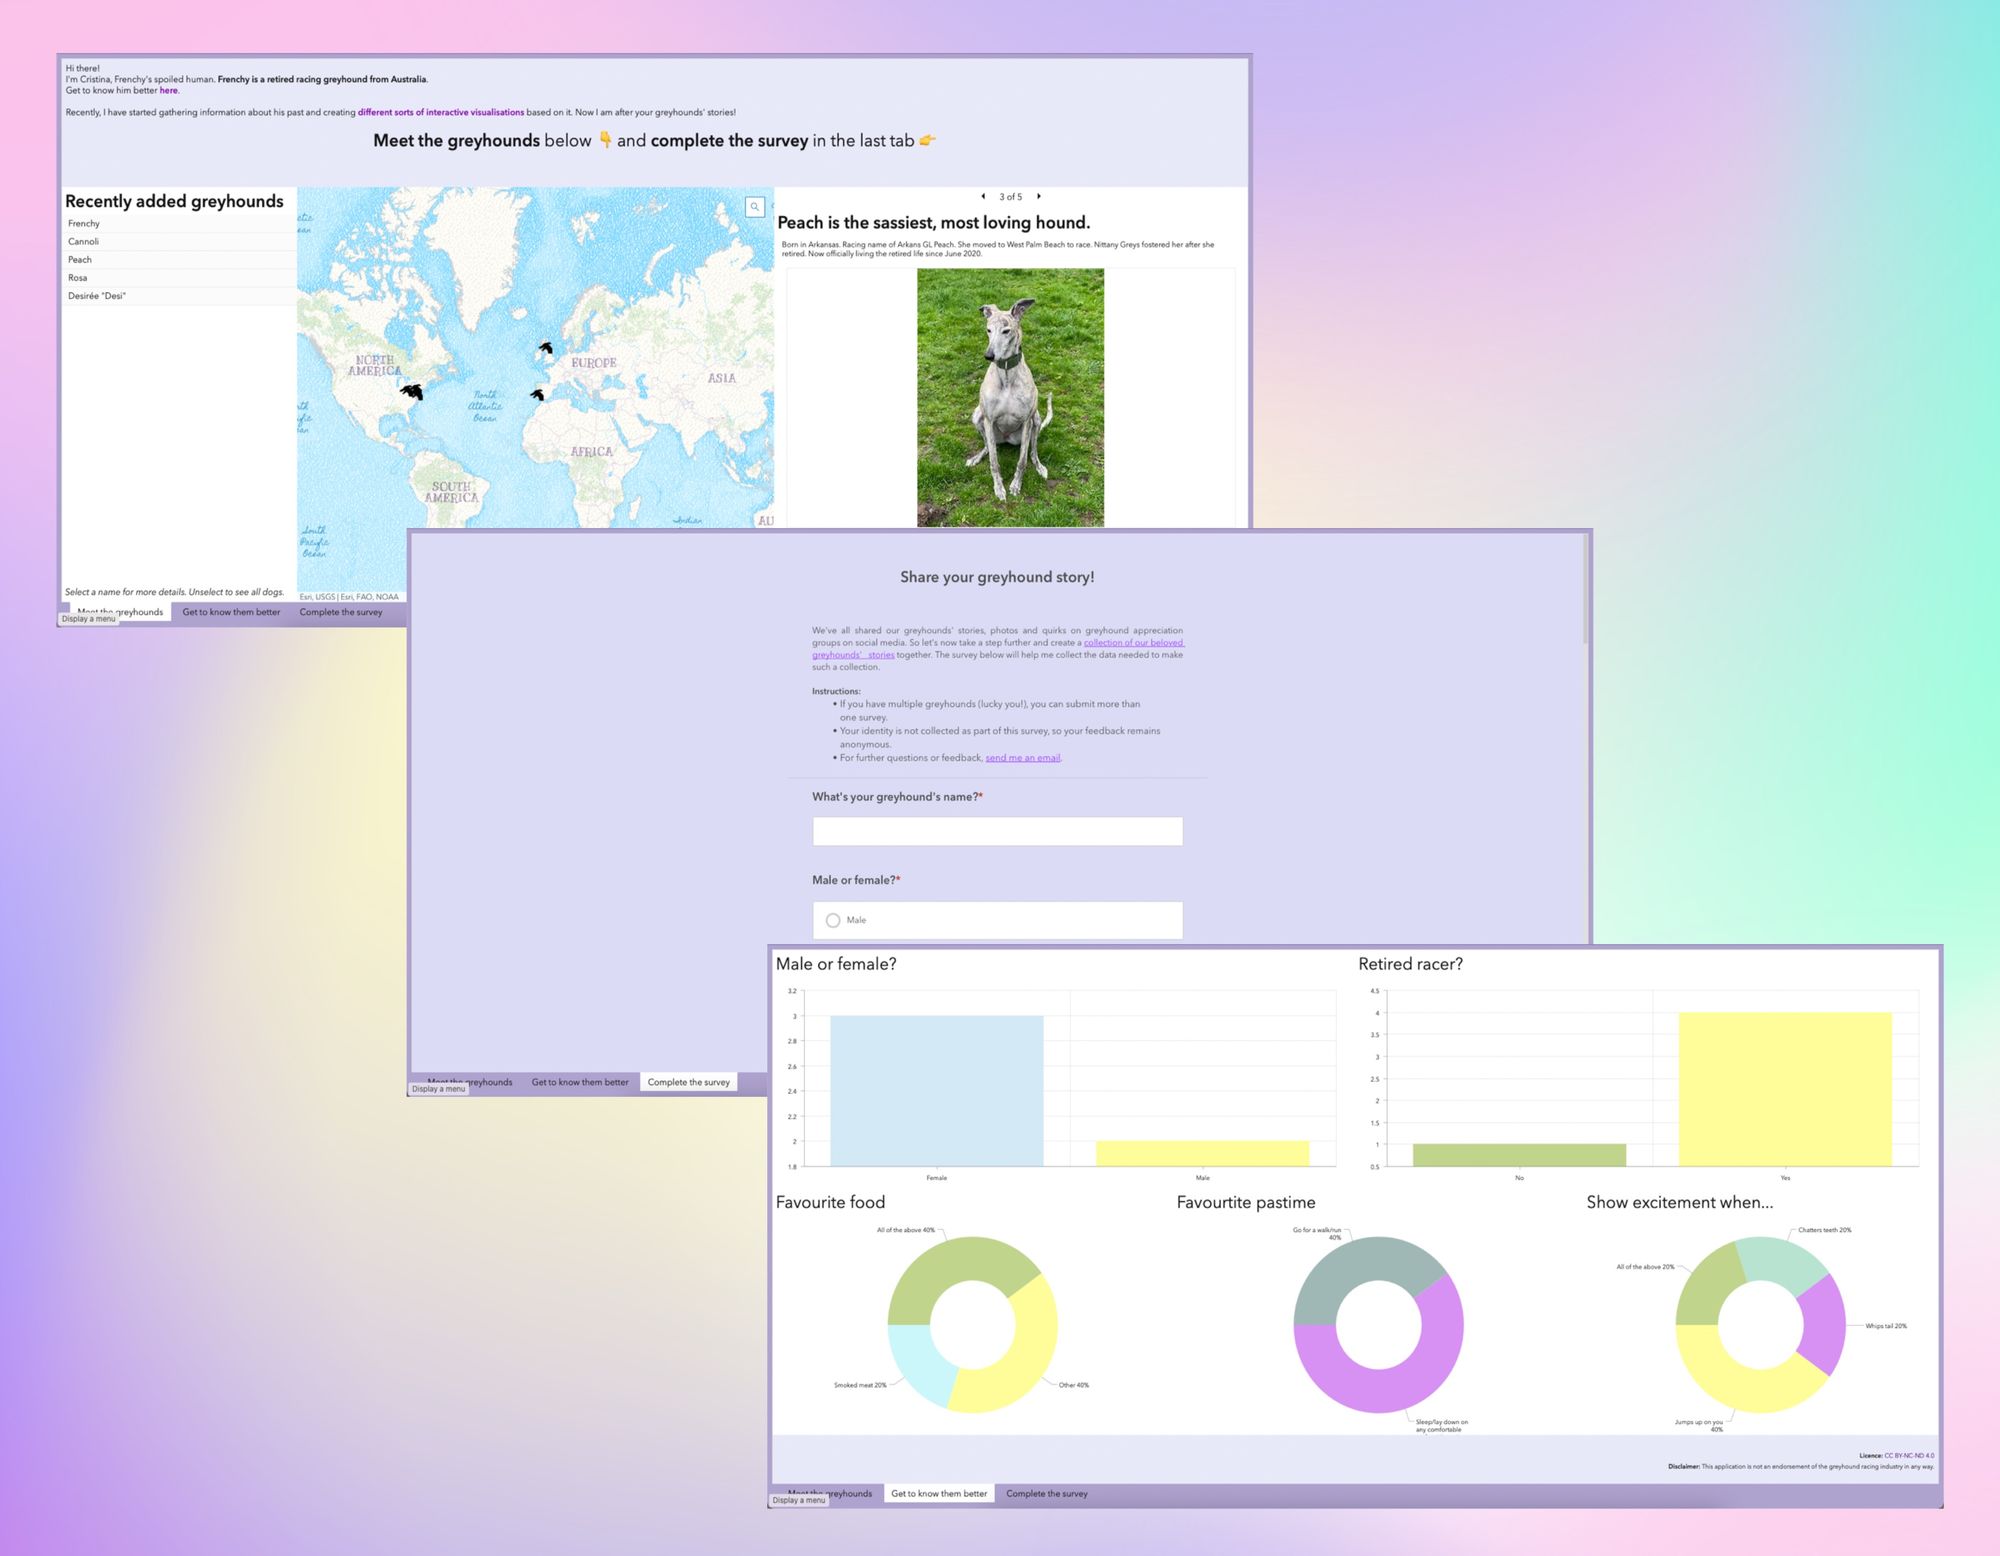
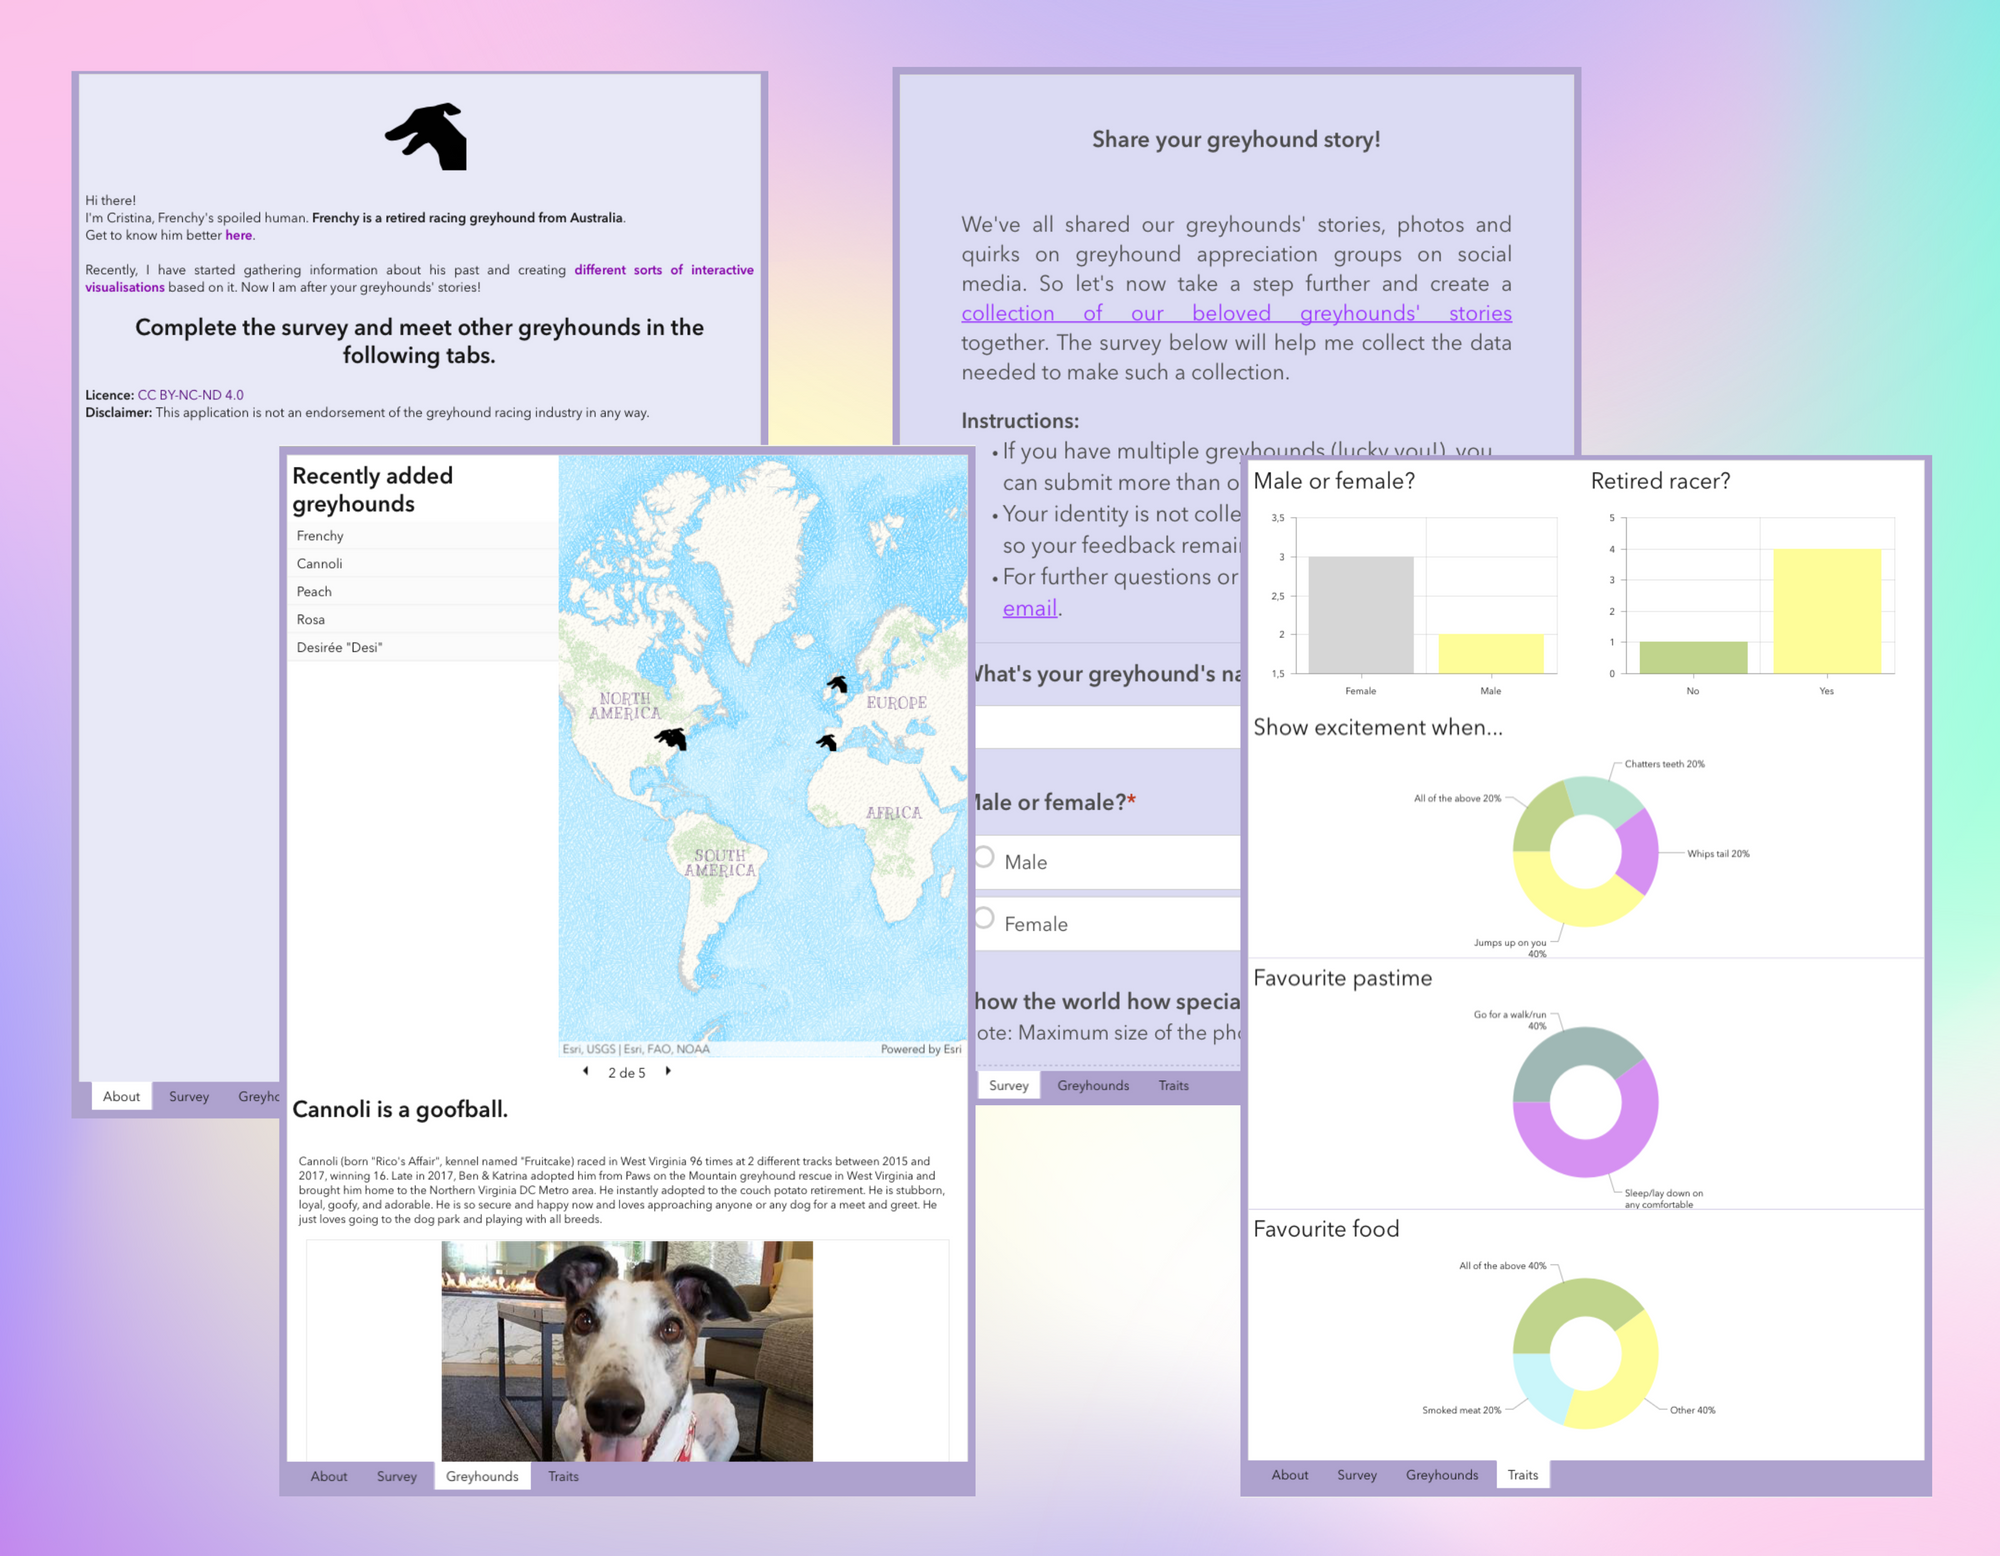
But first things first. I knew that I had to start with a survey to collect those stories. Then, I would be able to show the results in the form of a dashboard (you can tell stories with dashboards, too 😉). Finally, I knew I had to be mindful of the user interface since all these items were to show. And that was the trickiest part since dashboards usually look bad on mobile...
That's when I found a way to make the dashboard look great in every screen size: by using the Experience Builder 🙌
So, in this tutorial, I'm sharing the step-by-step workflow I followed to build a 3-in-1 web app that allows for crowdsourcing data, performing analytics and sharing stories while looking good on both desktop and mobile.
🤔 But Cristina, how can this kind of 3-in-1 web app be helpful to me?
- You want to collect data from users, visualise their submissions and perform analytics on the fly, sharing just one URL.
- You are researching a particular topic that requires crowdsourced data, and you want to monitor the submissions in real time.
- You want to ensure your dashboard shows correctly on every screen size.
💌 Enjoy this newsletter? You can help it (me!) grow and reach more people, which would be lovely. Forward to a friend or suggest a visit to the website!
Anything else? Hit reply to send me feedback or say hello.
See you next month!
Take care and keep learning,
P.S. Missed the last newsletter? I wrote about How to build a 3D hiking app. Read it here.


Member discussion