The Monthly with All That Geo – February 2022

Welcome back to The Monthly with All That Geo. Every issue will feature a data visualisation and spatial analysis tutorial based on a different tool. These tutorials are beginner-friendly and follow the CPCS method*:
- Choose the tool that best fits the purpose.
- Prepare the data.
- Create visualisations, analyses, and information.
- Share your work and knowledge in an accessible way.
*It's nothing highly scientific; I just made it up! 😬
💬 In this month’s issue:
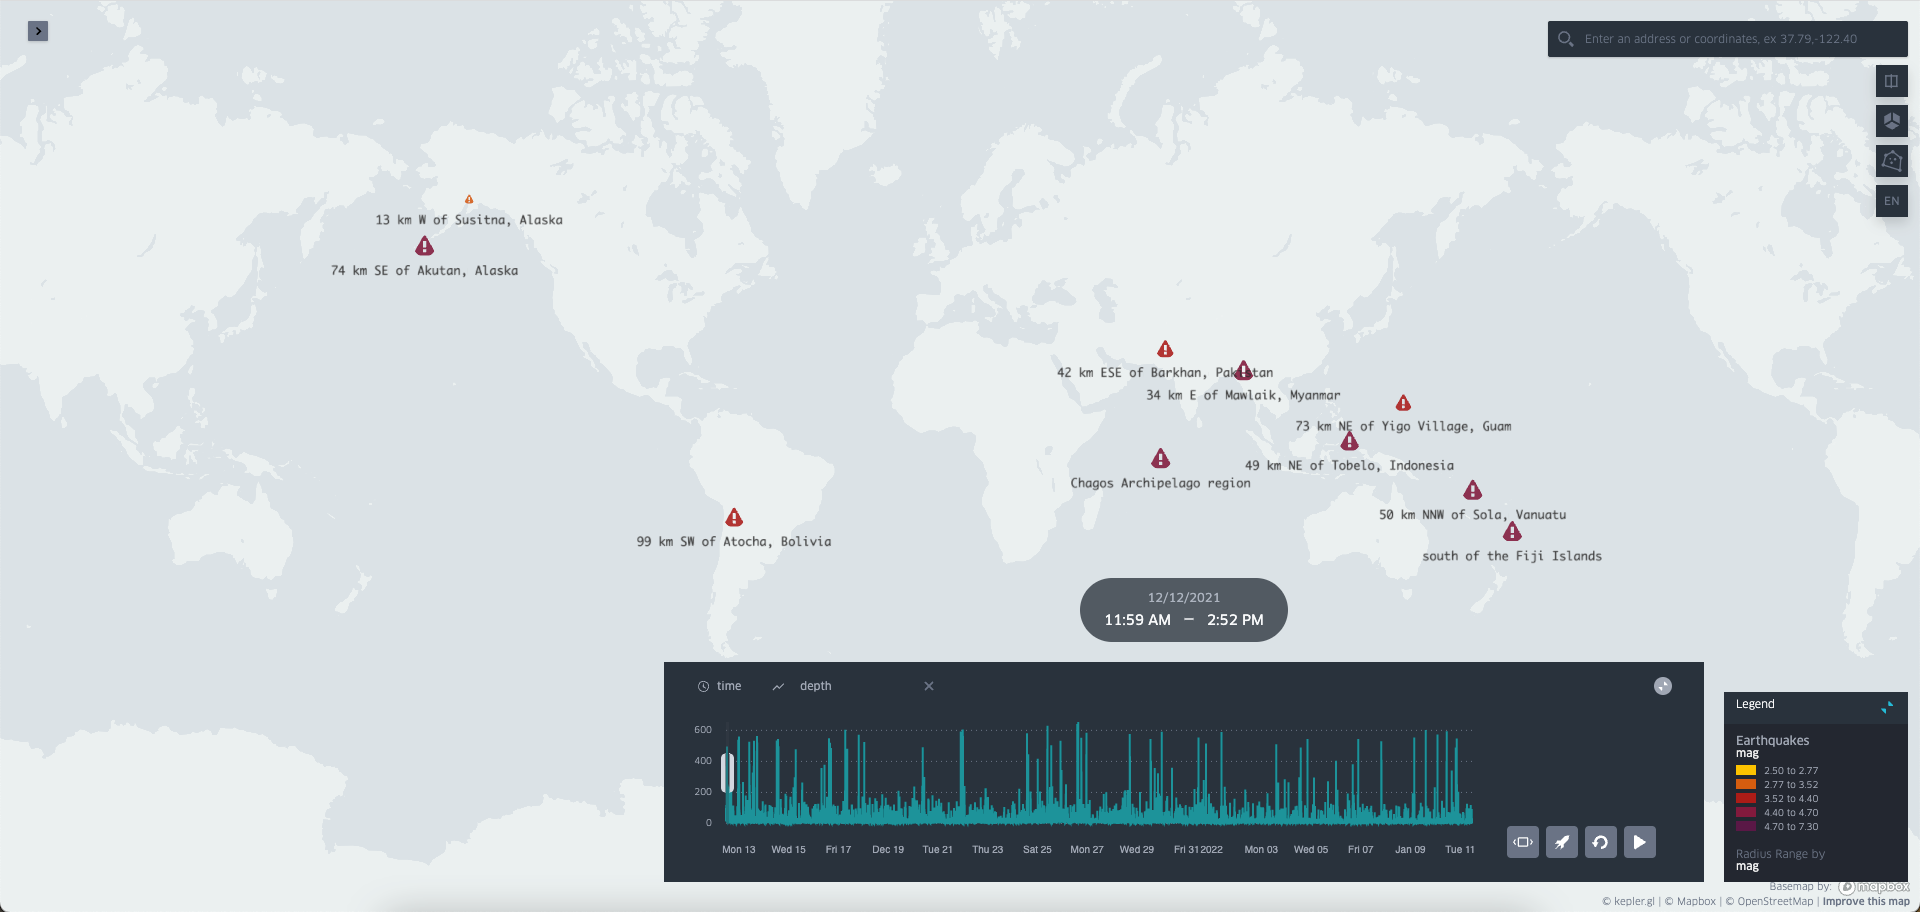
Create an animated visualisation of earthquakes data with Kepler.gl
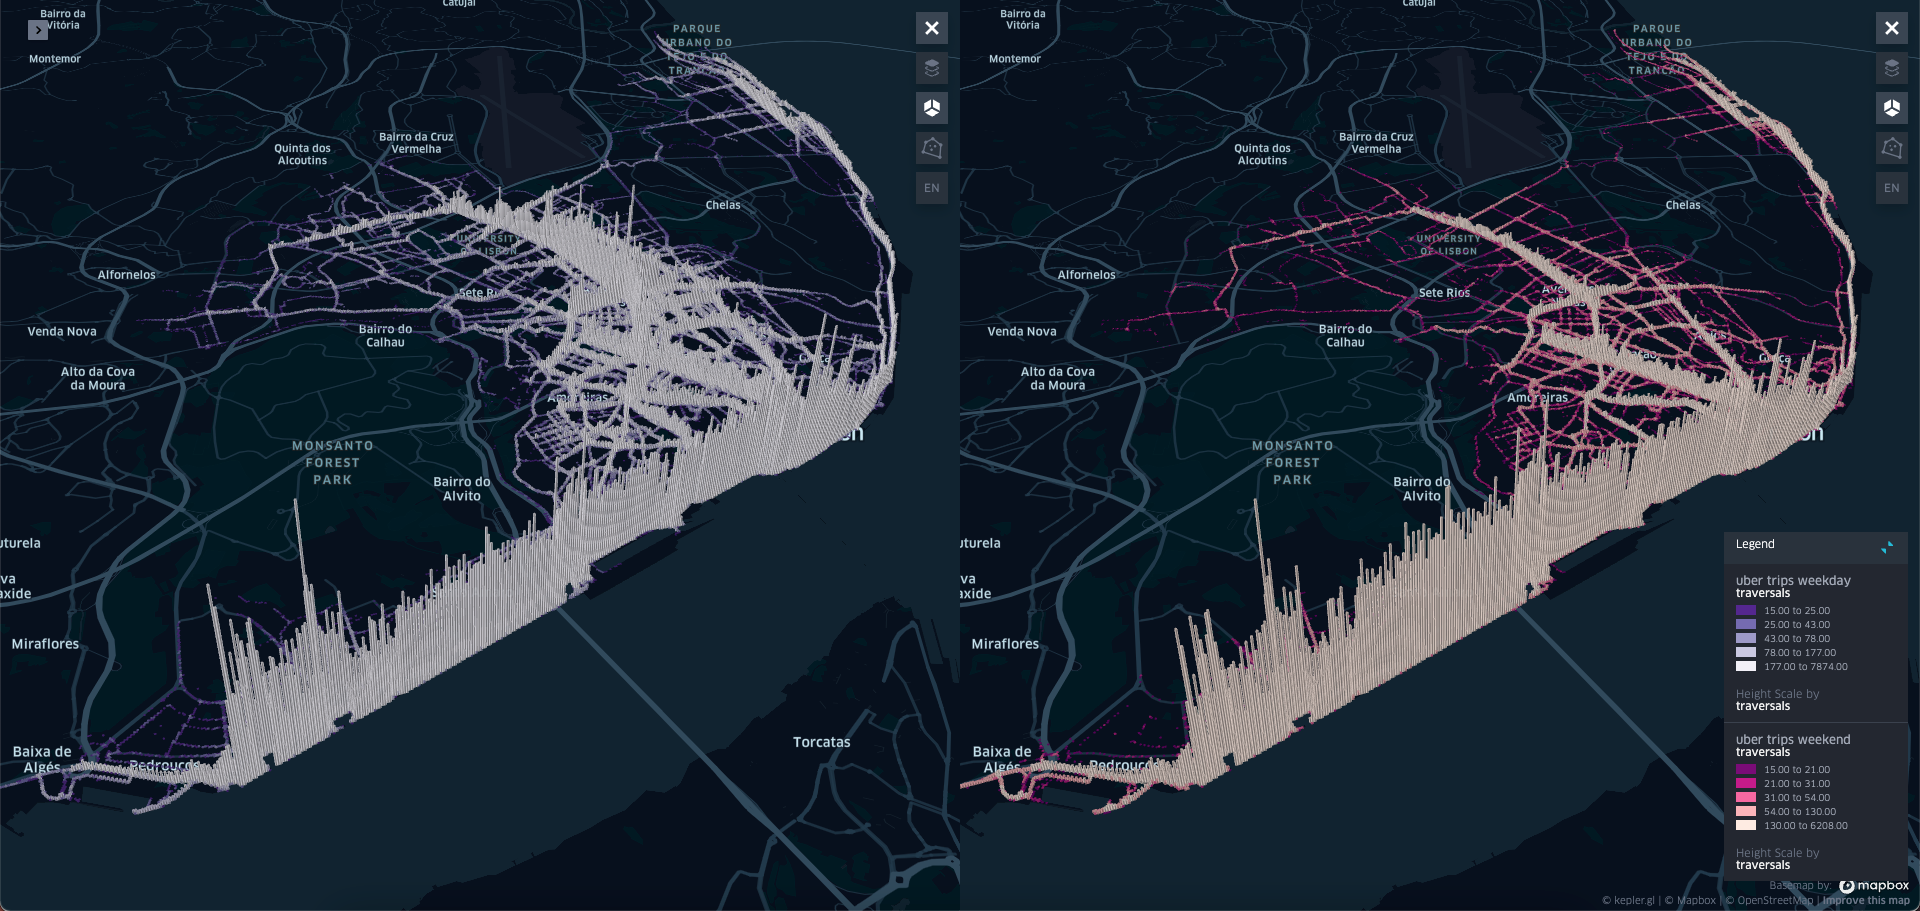
Create a 3D visualisation of urban mobility data with Kepler.gl
By the end of these tutorials, you’ll be able to leverage Kepler.gl’s capabilities and create compelling data visualisations.
Next month you can expect another tutorial that will guide you in the process of creating and sharing a visualisation built from a given dataset and using a specific tool. With these tutorials, I aim to inspire you to:
- Integrate new techniques in your projects.
- Diversify your skill set.
- Build that portfolio you’ve been procrastinating 😉 .
Happy learning!
💌 Enjoy this newsletter?
Forward to a friend and let them know where they can subscribe (hint: it's here).
Anything else? Hit reply to send me feedback or say hello 👋.
See you next month!
Take care and keep learning,


Member discussion